
Introducing our US election visualization package
The US election this November promises to be one of the biggest stories of the year. A data-driven event, where visualization of vote tallies stands
The US election this November promises to be one of the biggest stories of the year. A data-driven event, where visualization of vote tallies stands

2023 was a turbulent year on the international stage. Conflicts in Europe and the Middle east dominated the news, as did reports of tension between
We are thrilled to announce our latest partnership with Polygon, a leading financial data platform, marking a significant milestone in revolutionizing the way financial data
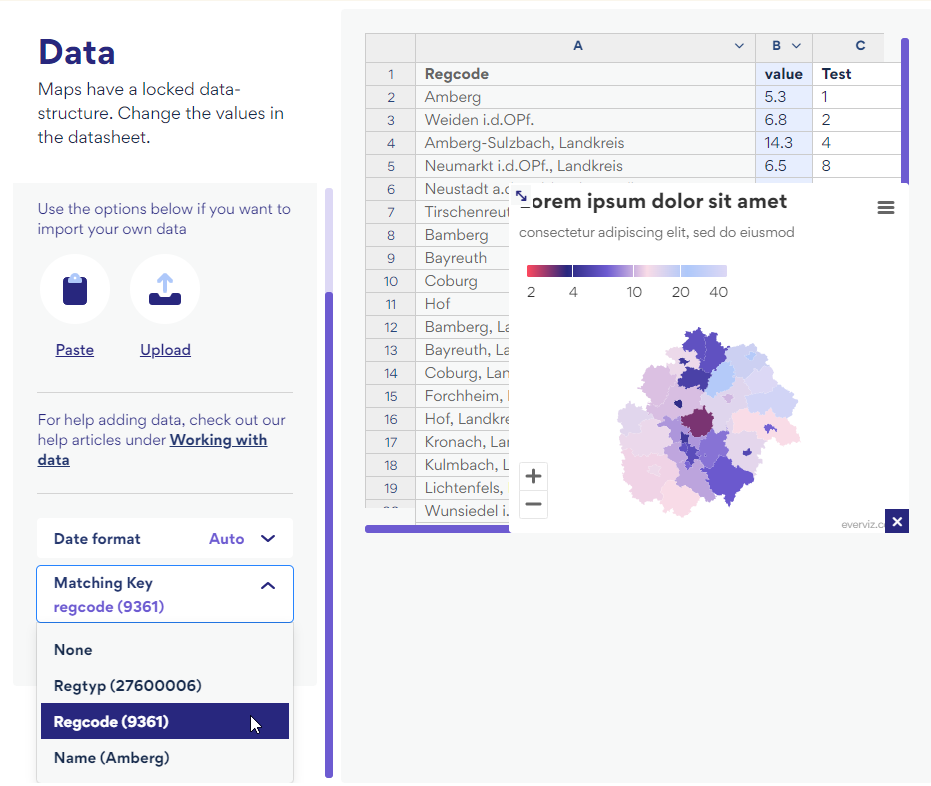
We have some exciting new updates to share. Working with maps and multiplatform publishing just got easier. With the introduction of dynamic fonts, chart text

Last week, everviz participated in the International Broadcasting Convention (IBC) for the first time. It was a whirlwind ride where we learned a ton and
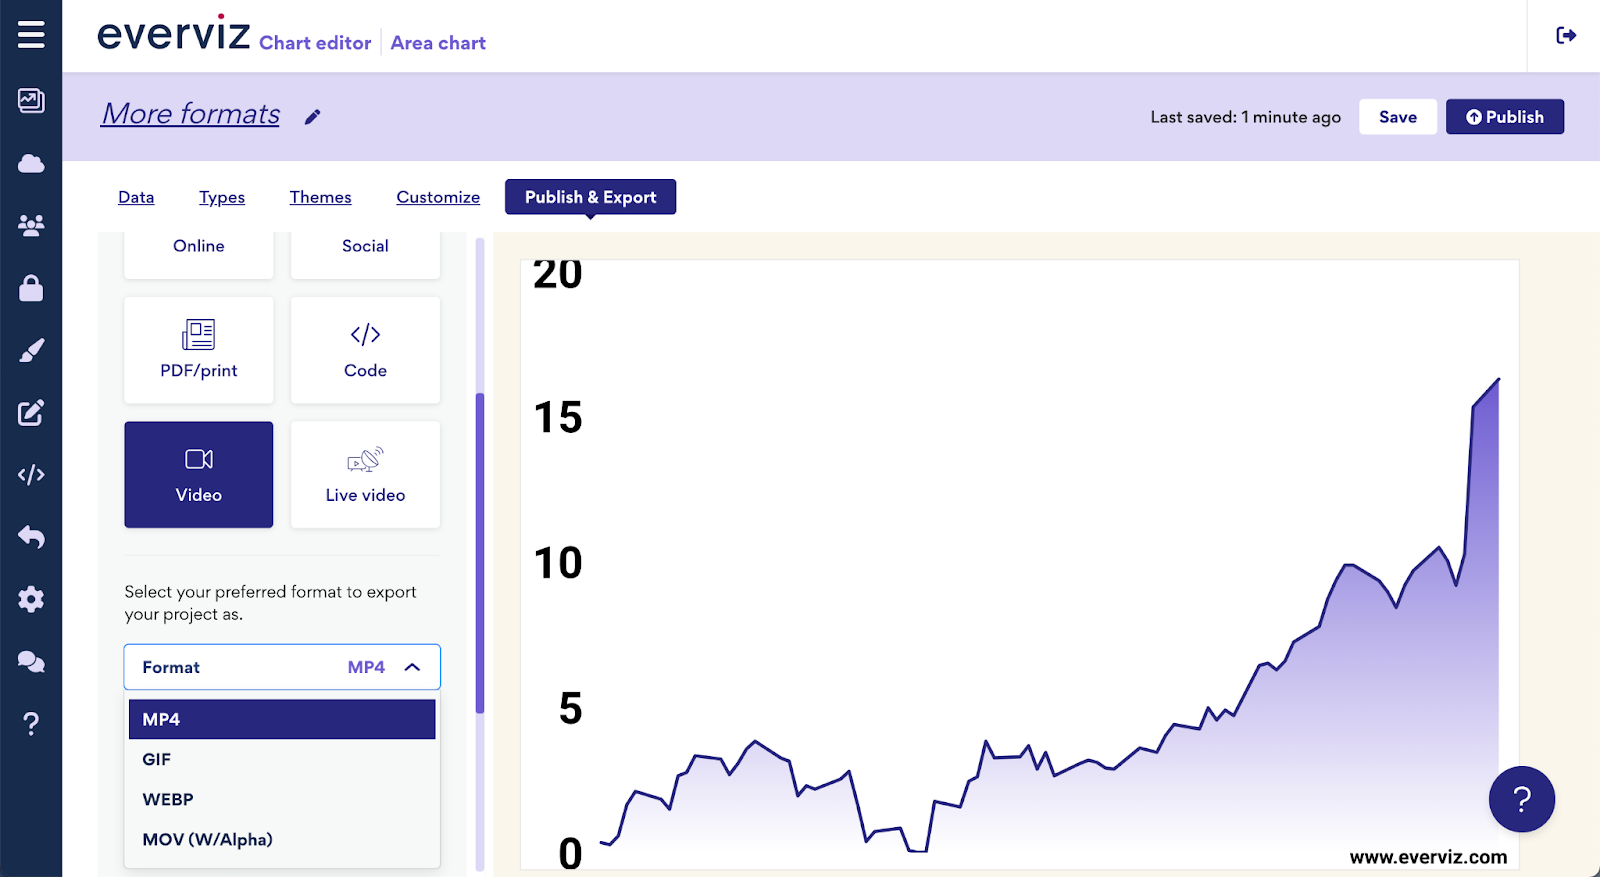
Expanding upon our recent announcement of multi-platform visualizations, we’re thrilled to introduce even more versatile formats to enhance your content. Enhance your visual content with
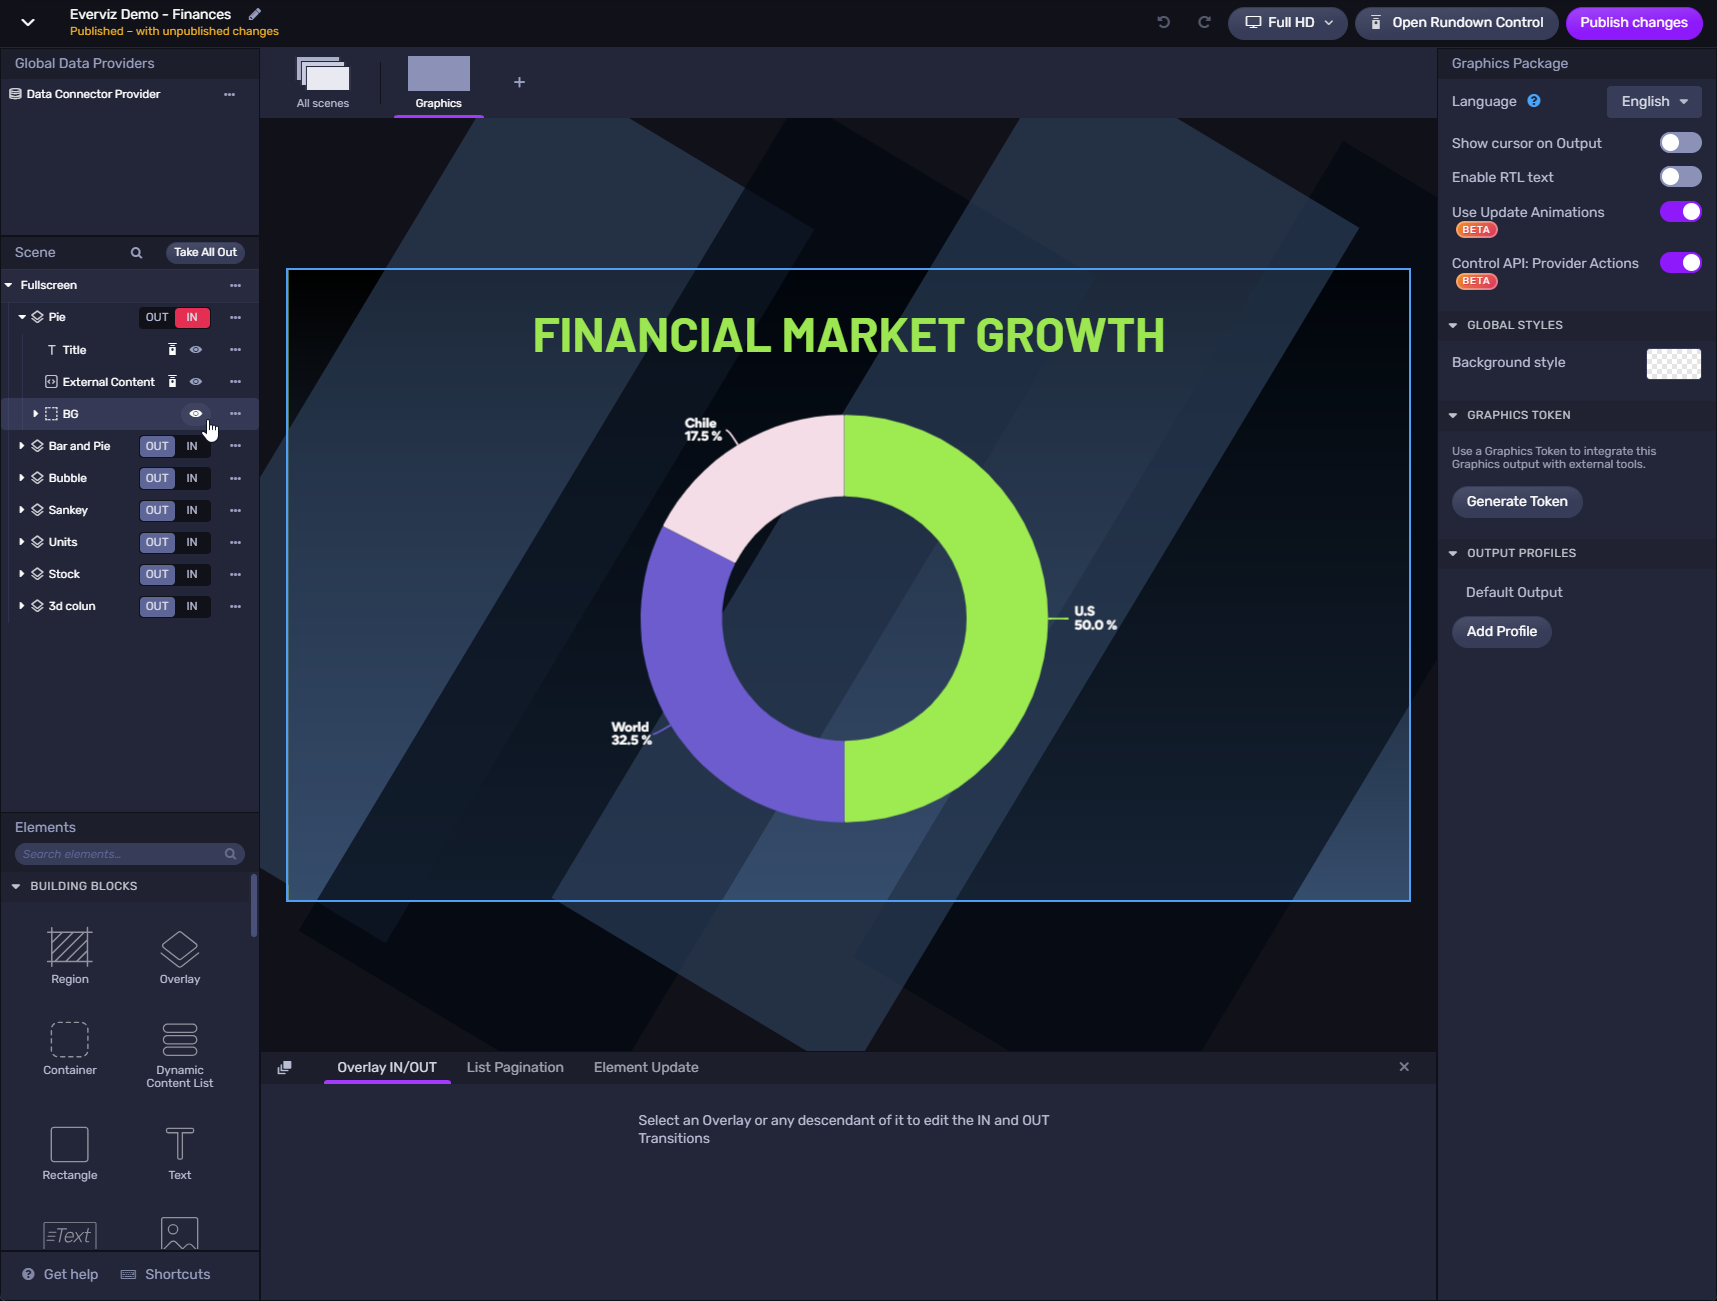
📺everviz charts can now be seamlessly inserted into live video – making multiplatform data visualizations possible. Until now, making charts for live video required specialist

We are pleased to welcome Amy Cesal to the team as our Product Evangelist. Amy will liaise with our chart designers to create charts and
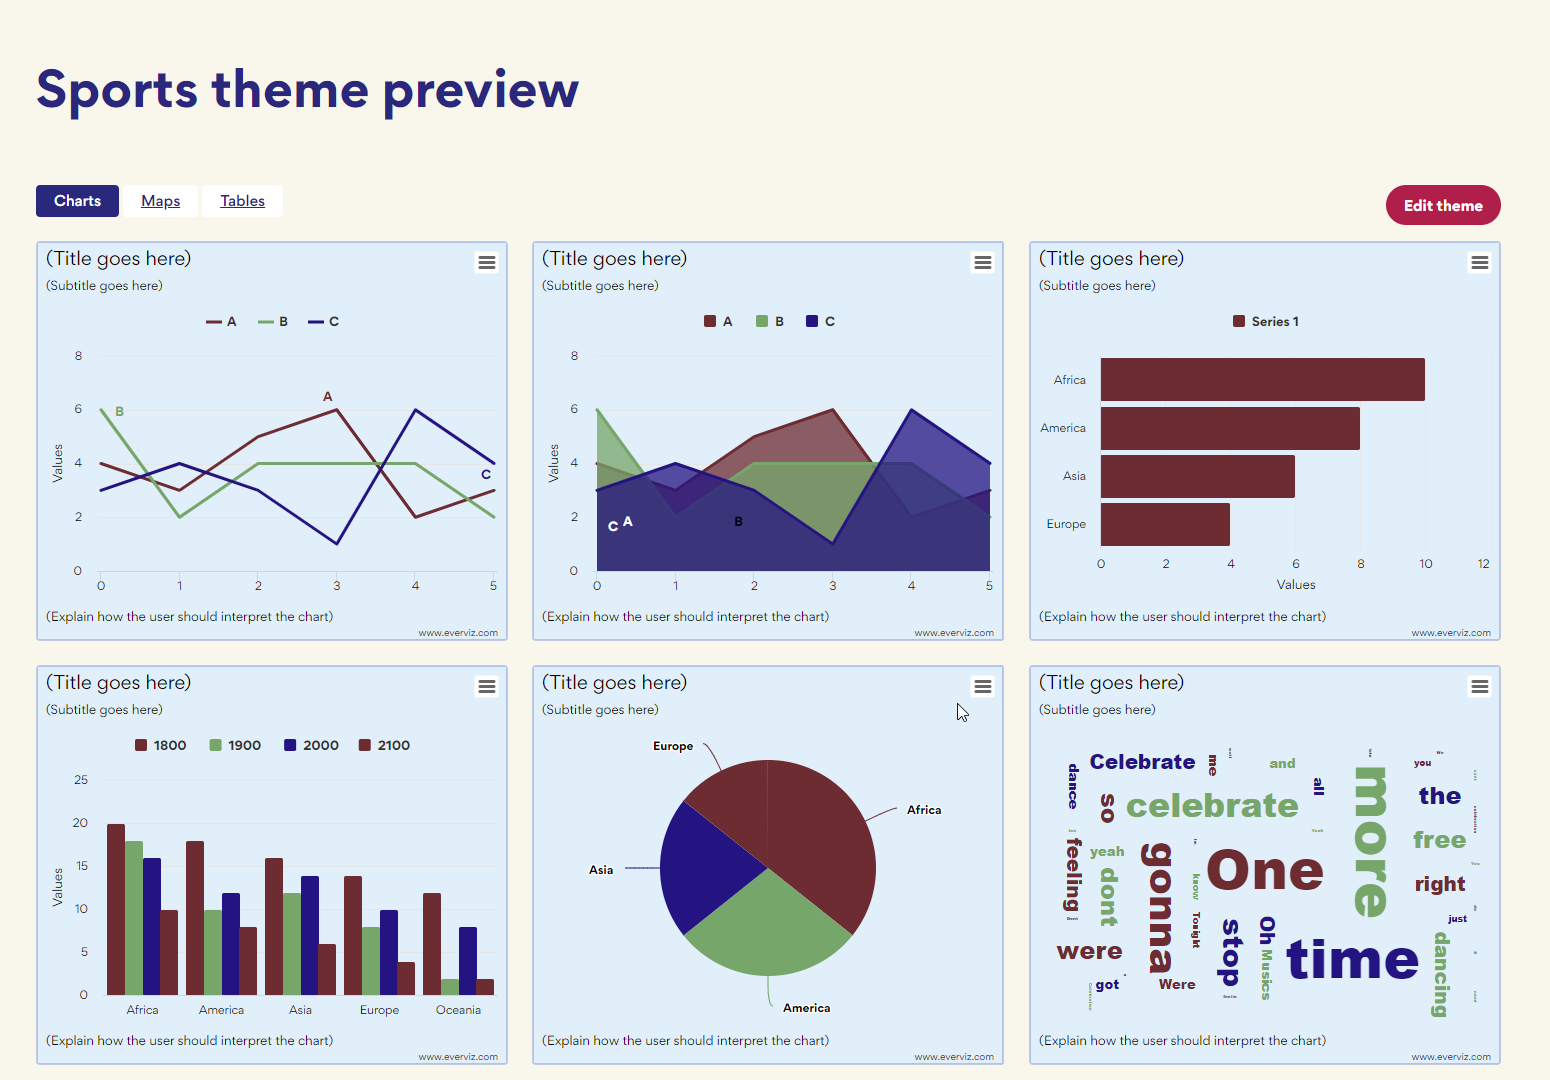
Themes is an easy way to ensure all your charts load with your organisation’s branding.

Another year of global turmoil is coming to an end. Just when we felt hopeful in the beginning of the year, after two years of

Together, we will empower customers with solutions that help improve every step of the media content lifecycle. Today we’re excited to announce a major milestone
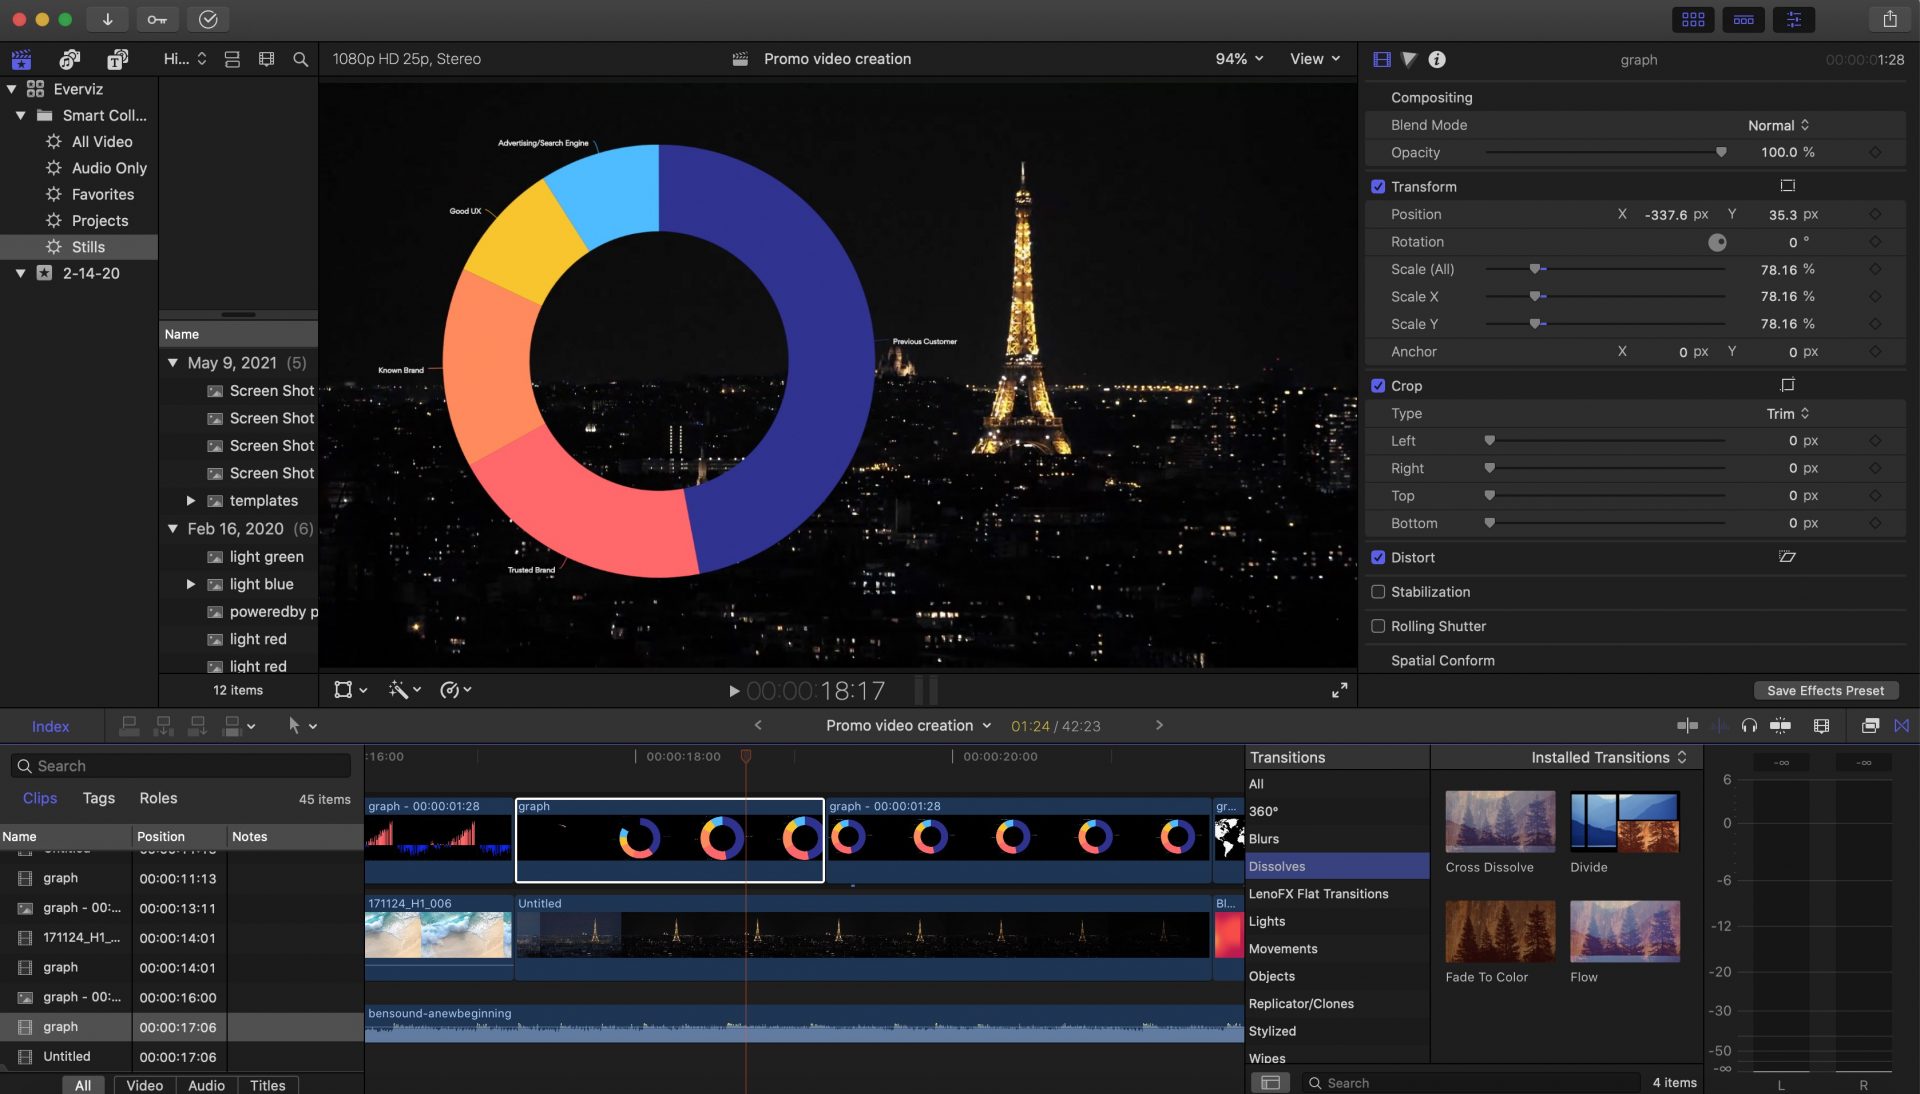
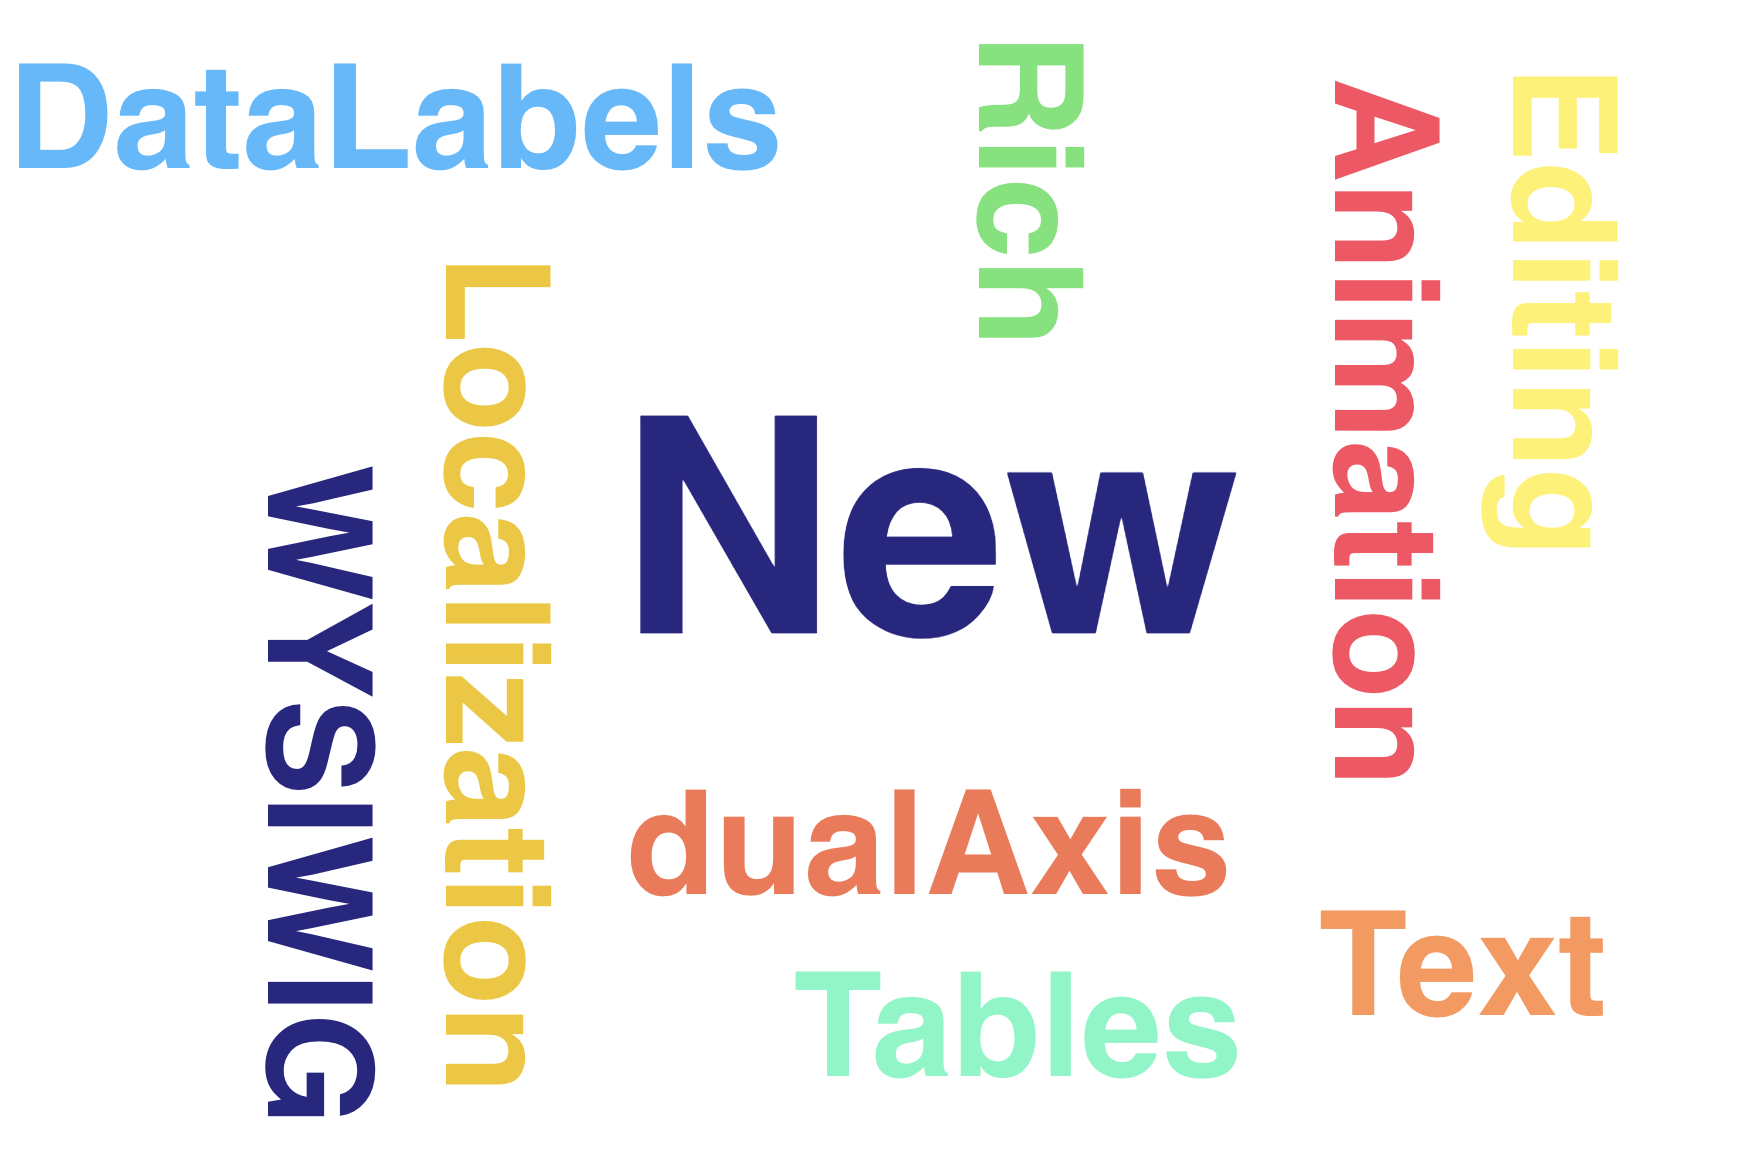
Over the last couple of months, we have made some massive improvements to the editing experience in everviz. This article dives a bit deeper into the improvements and explains how you can use them.
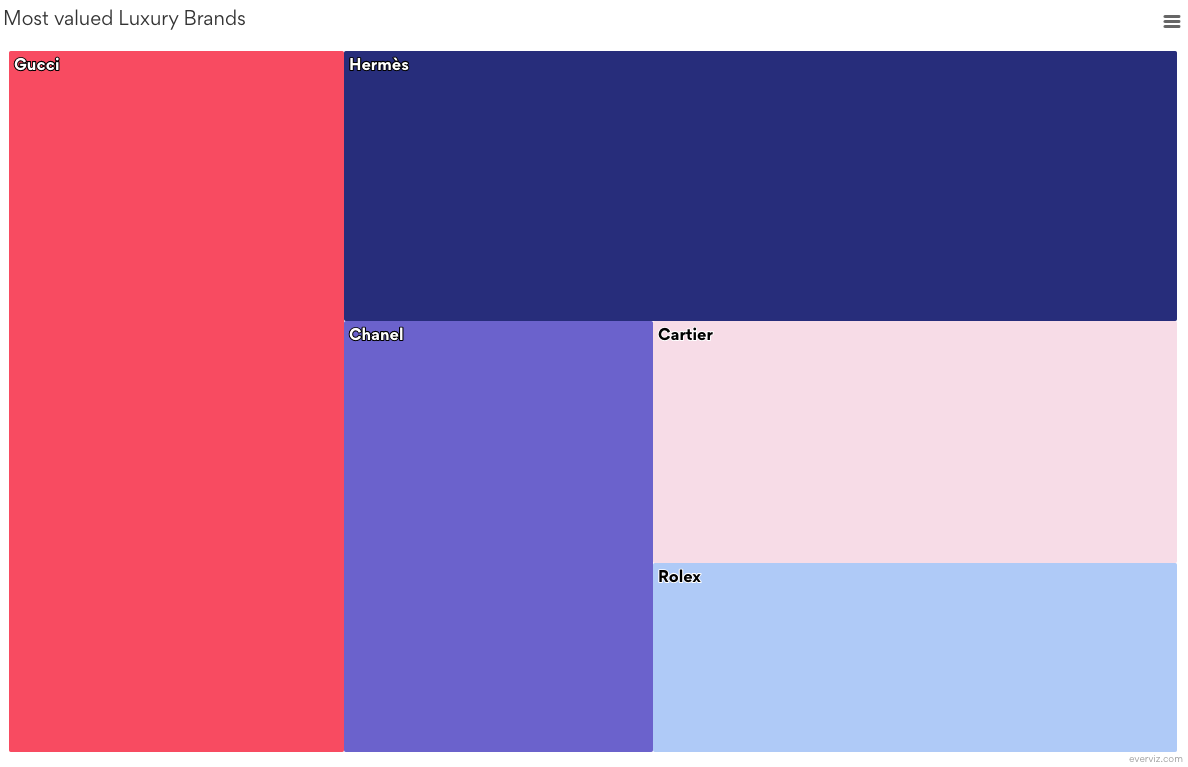
We are excited to announce the introduction of a new chart type to everviz: the Treemap What is a Treemap? A Treemap displays data as
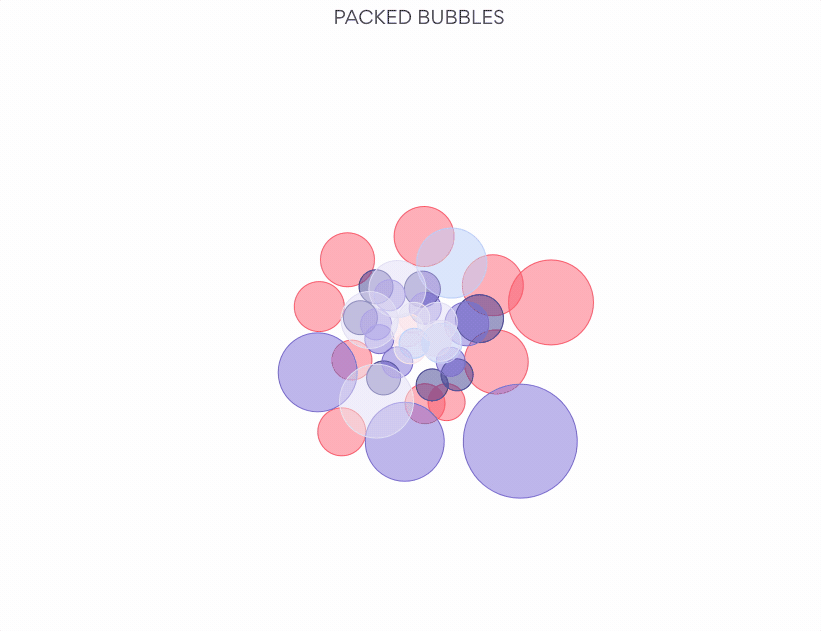
With everviz, you will have a variety of different choices for visualizations. We’ve just added another simple yet detailed and insightful visualization to your toolbox:
We’re happy to announce that we have signed an agreement with Swedish market leading news automation experts United Robots. Our powerful data visualization tools will
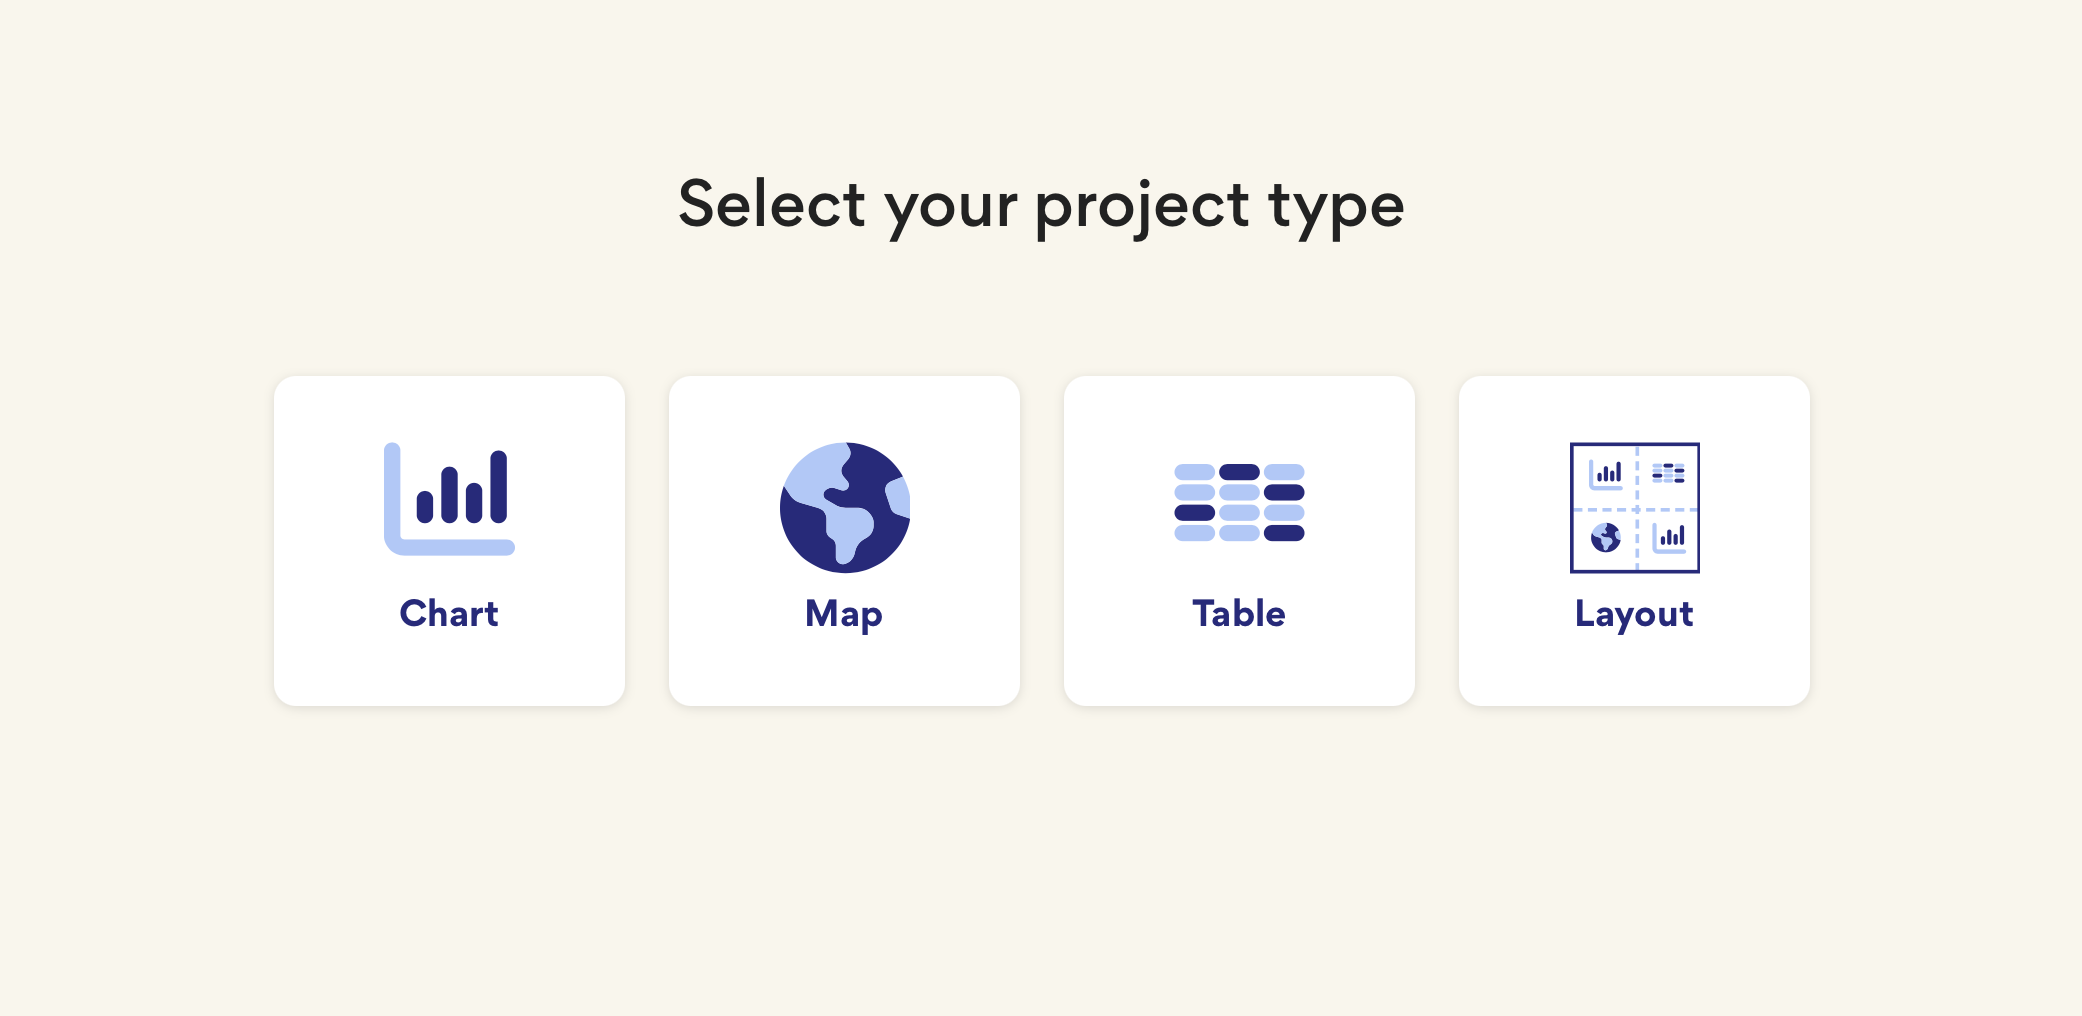
We just released a major upgrade to the Project Wizard, based on feedback from our users. This article explains the improvements and how you can
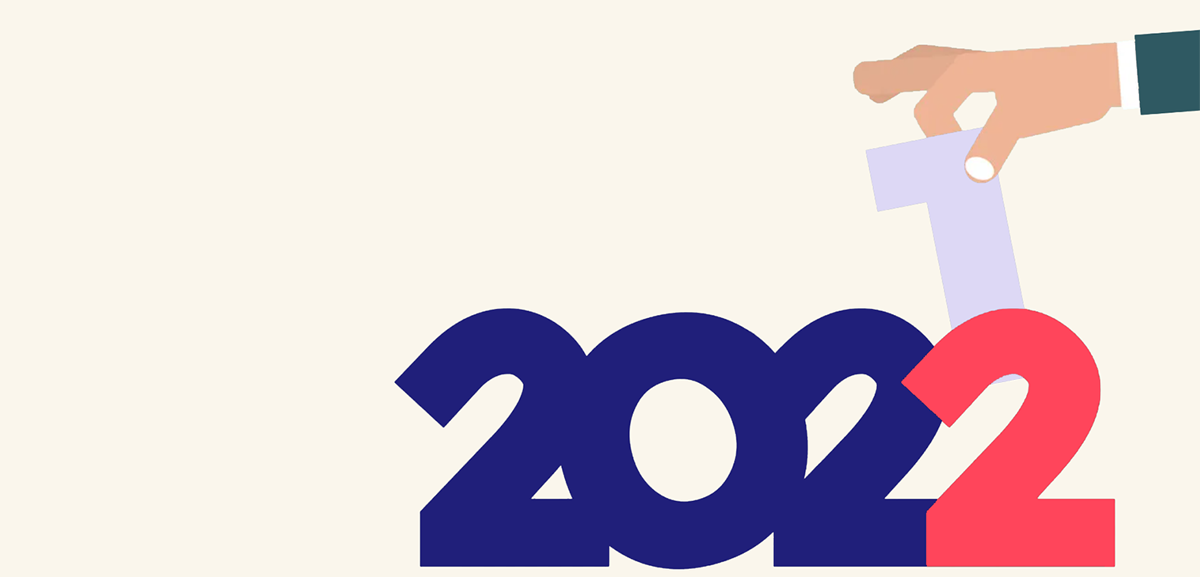
Another strange year is soon coming to an end. Also this year has hit various businesses, communities and individuals hard. On top of that, the
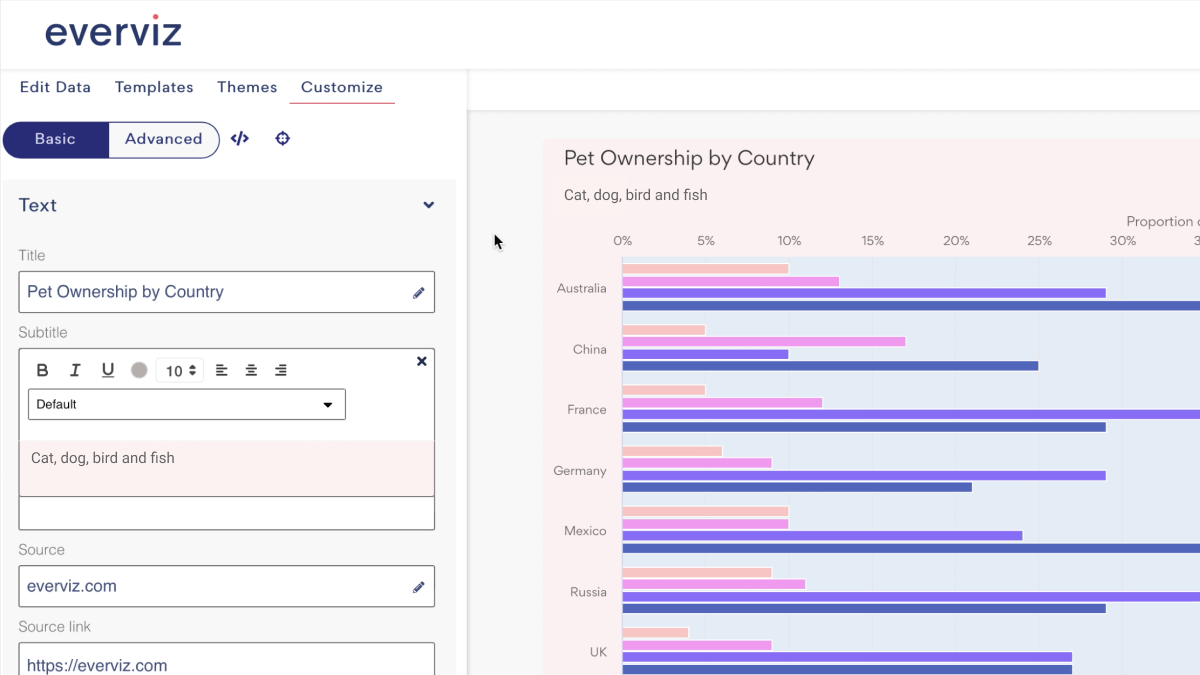
Adding texts to your visualizations is now simpler than ever. With the latest update of everviz, you now have access to editing all texts in
We’re excited to share with you a new feature in beta: Download project as video Our mission is to make it easy for anyone to
At everviz, we aim to keep things simple, yet powerful. These are two orthogonal (independent) adjectives, and almost like describing something that is red, yet
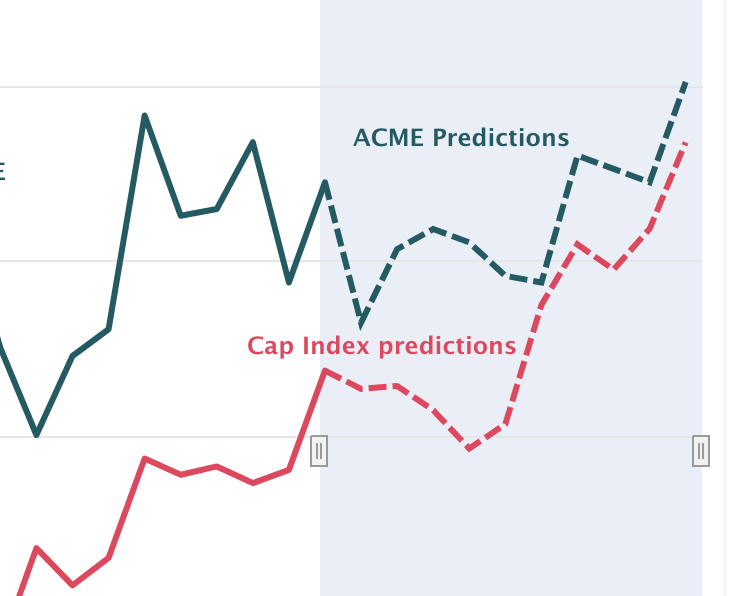
Reference Lines, Plot Bands, arrows, ranges or goal lines! These are just a few ways you can Highlight your data to help your audience better

We have some exciting news to our customers on a WordPress platform. A new everviz WordPress plugin is available, which will help you manage everviz
Here is a quick rundown of some of the features we have added to everviz recently. Improved annotations The annotations are now more reliable in
We have just launched our next generation export server. This article explains what the export server is, why we redesigned it and how you can
We have been busy adding features to everviz that will help you become even more productive with visualizations. Follow us on Twitter or Facebook to
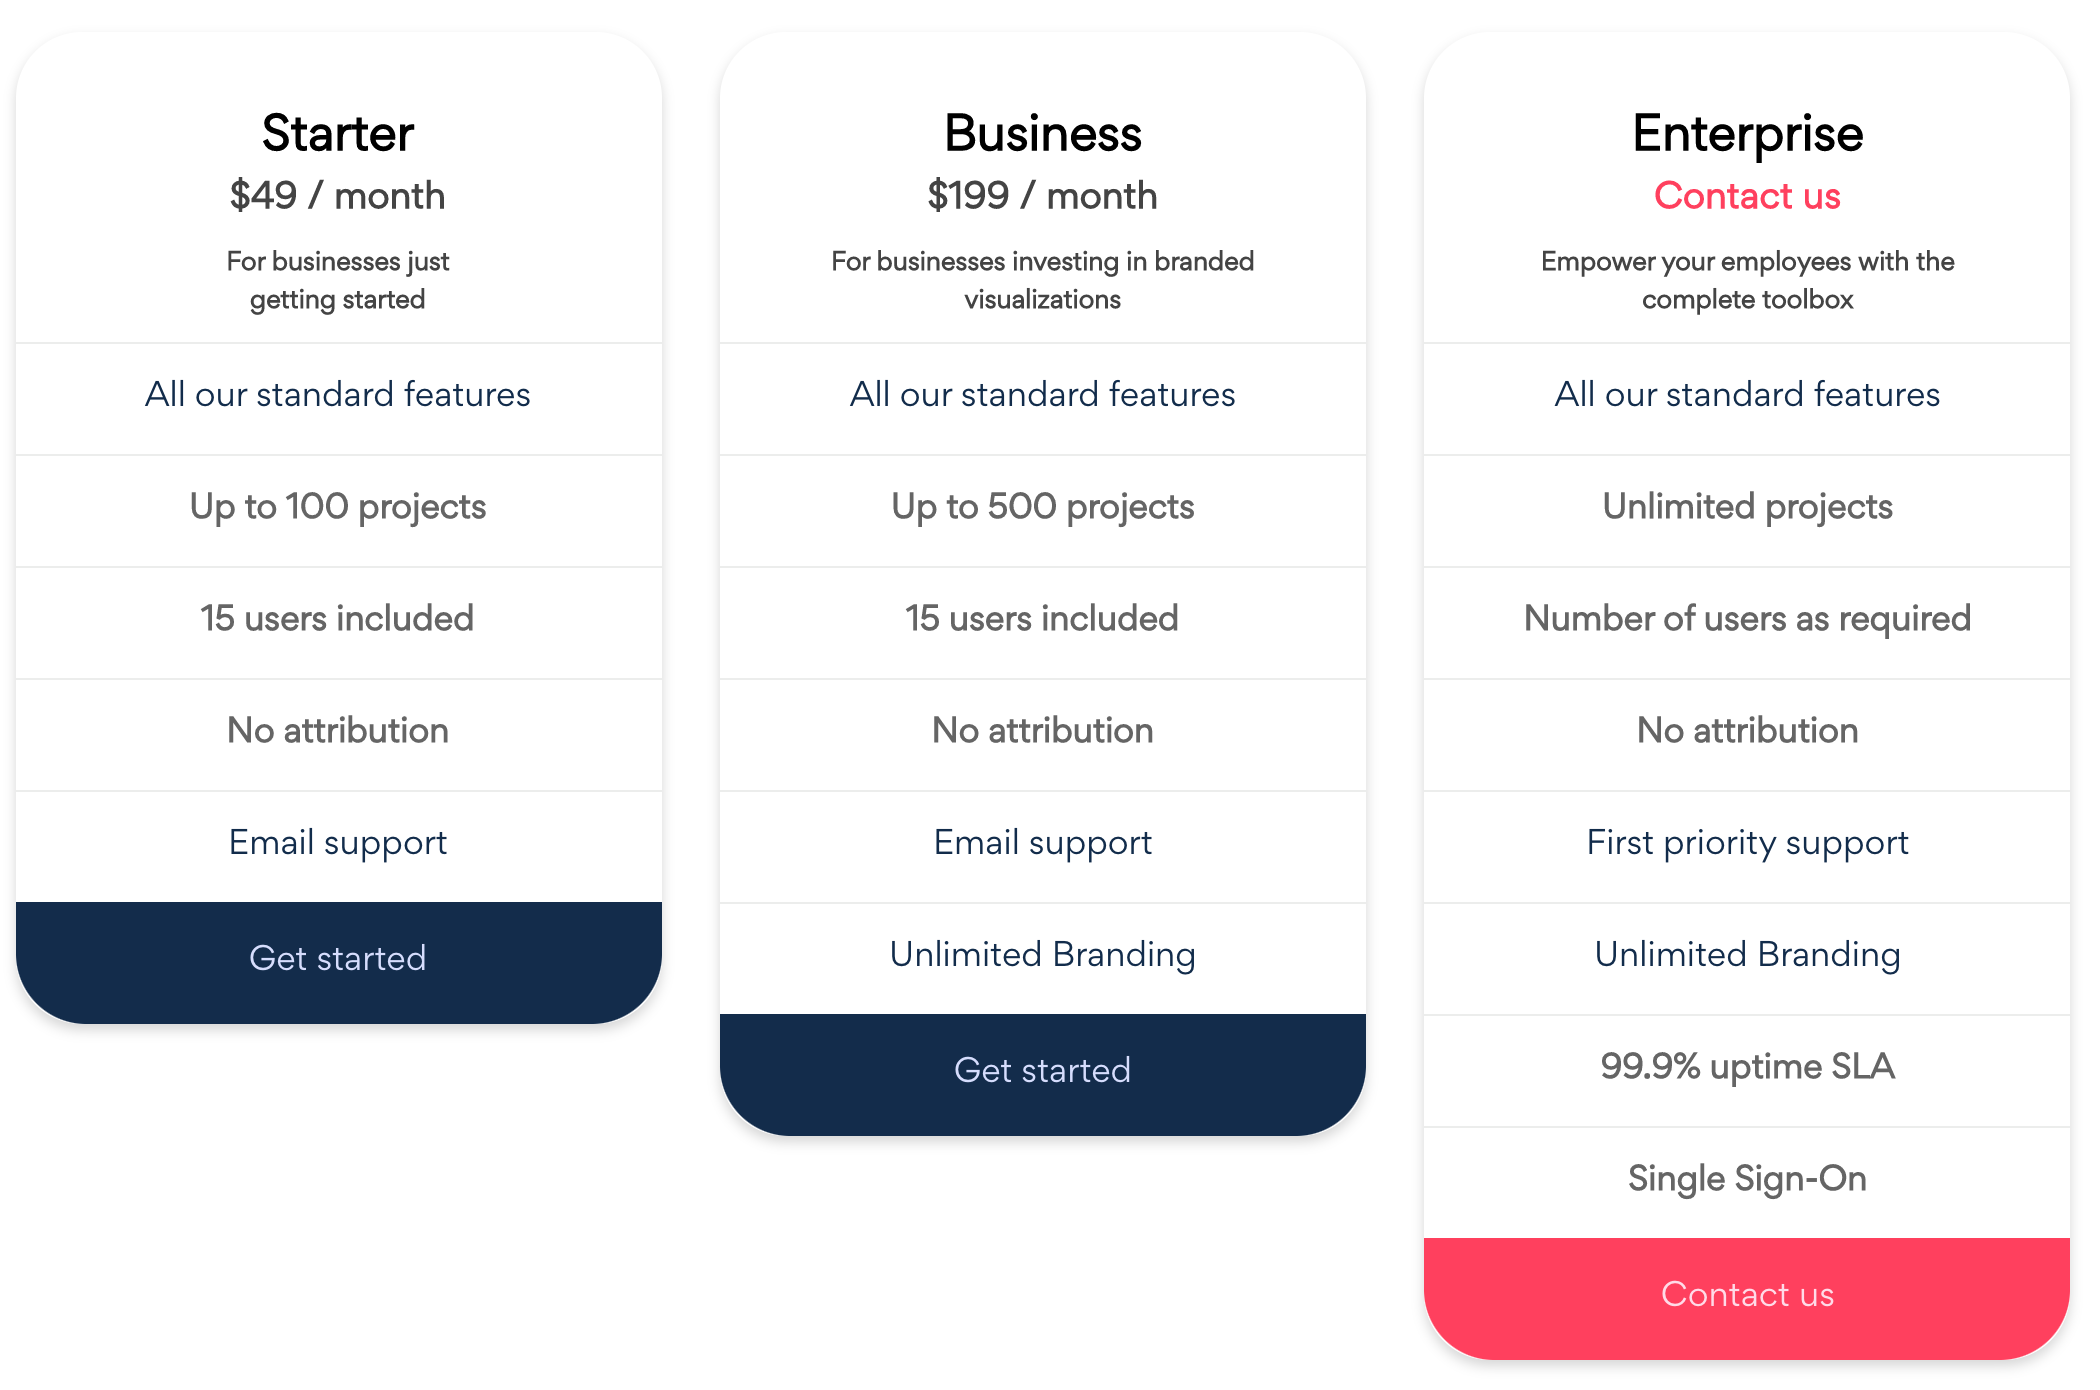
For the first time in 3 years, we are making an update to our pricing model. Based on feedback from customers, the price per-user model
Our customers keep society well informed, telling stories with data in an easy and understandable way. Our top requested feature in everviz has been to
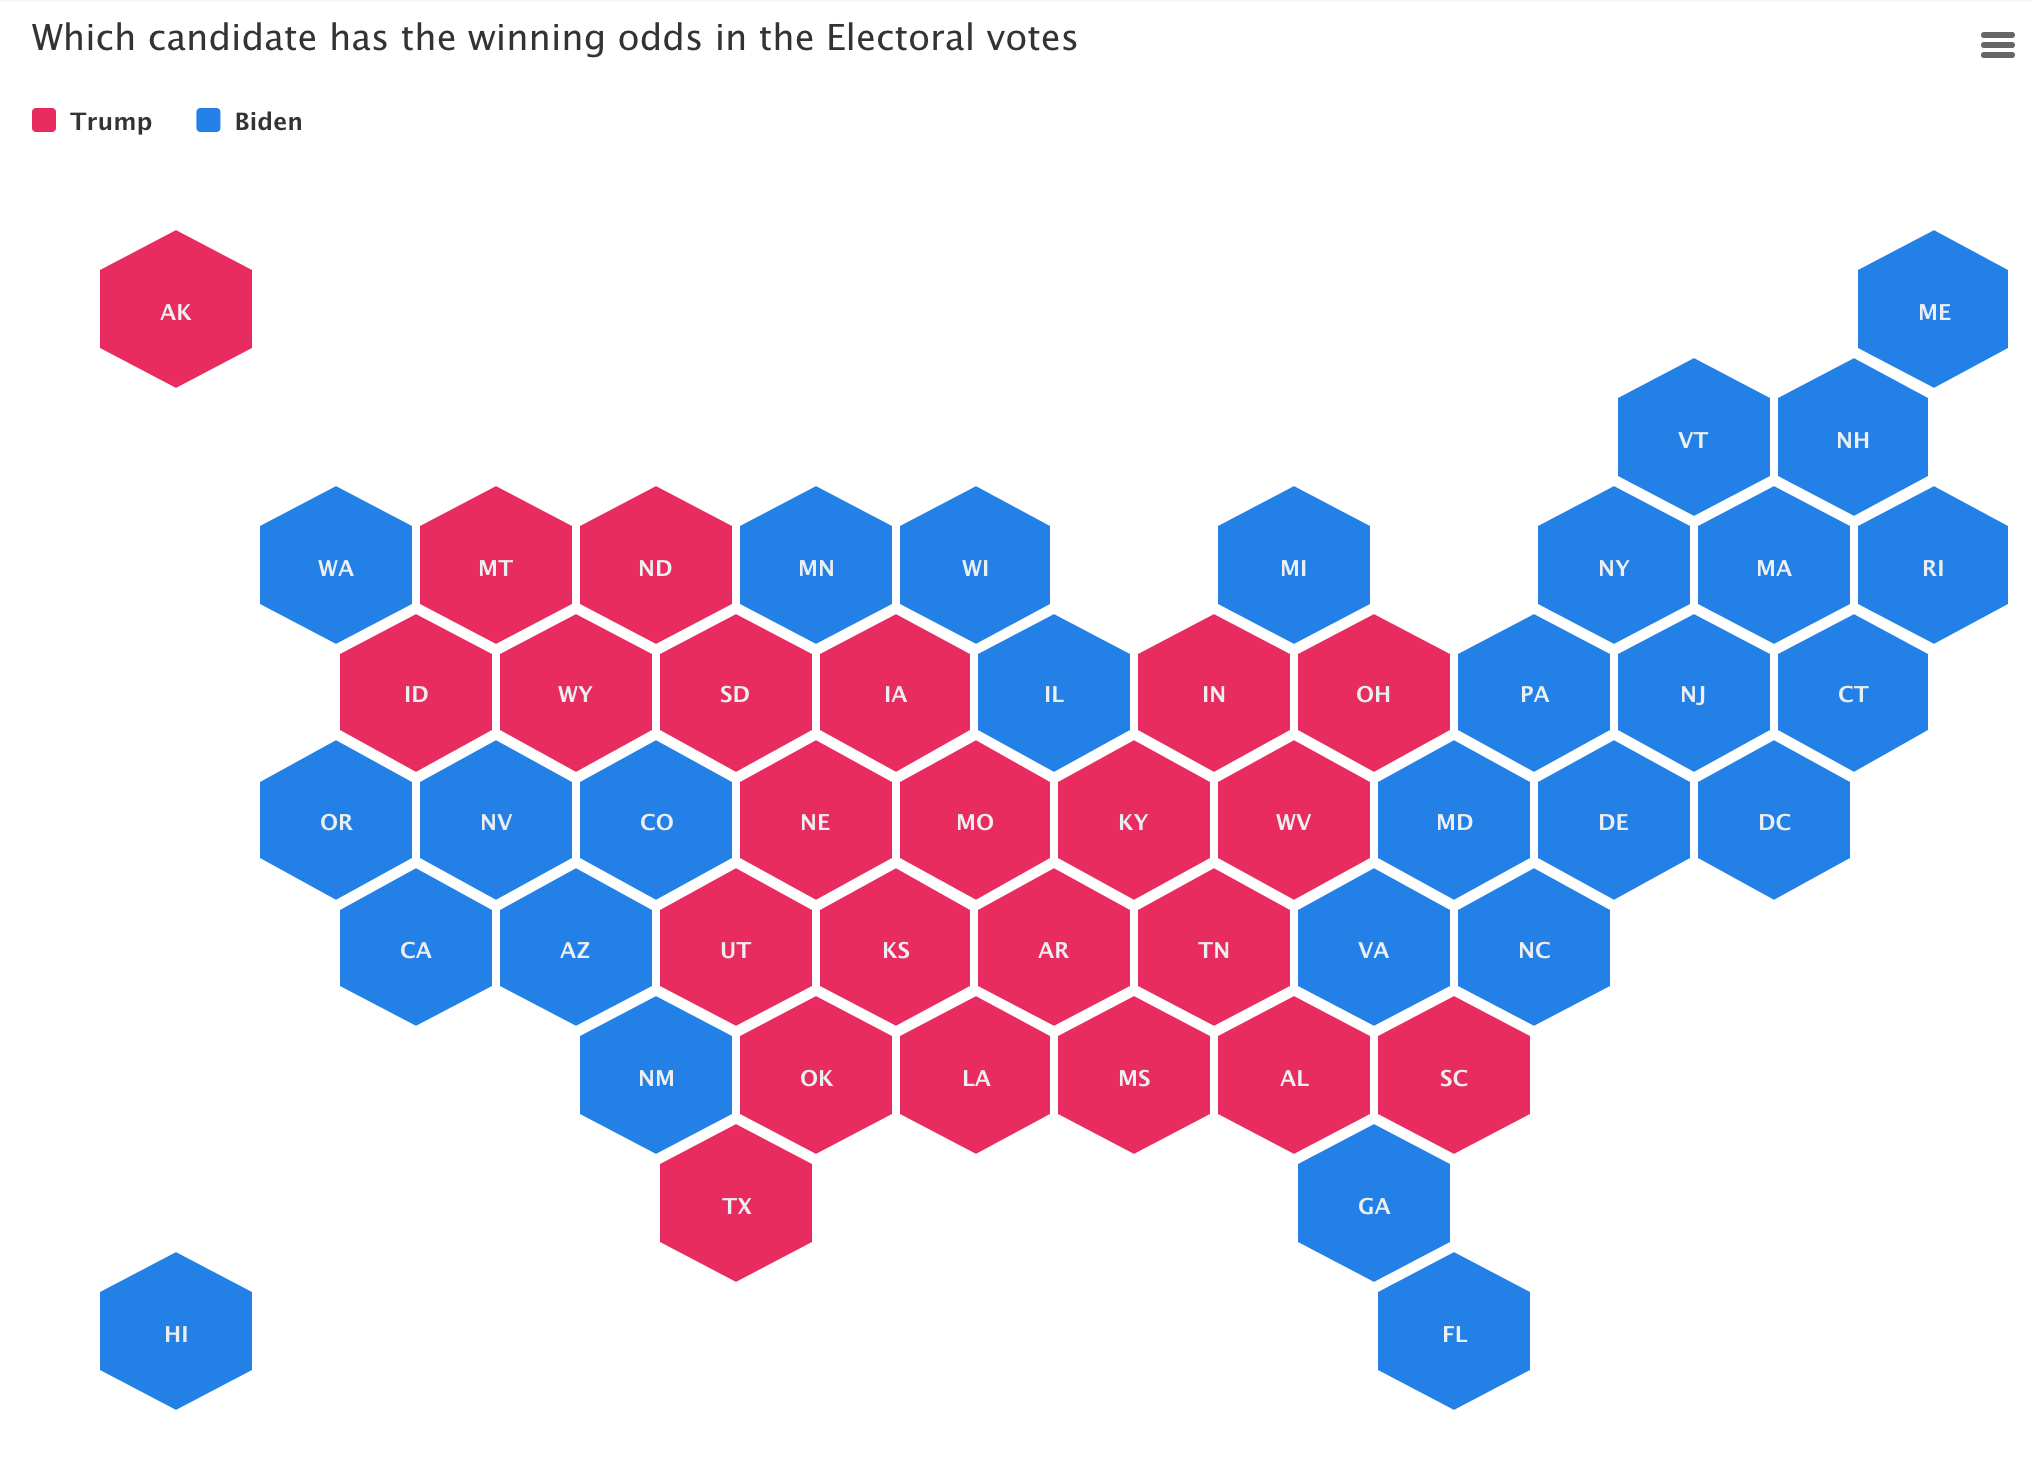
During election times, readers want more than just good writing, they want great graphics and interactive charts and maps. We believe the time is ripe
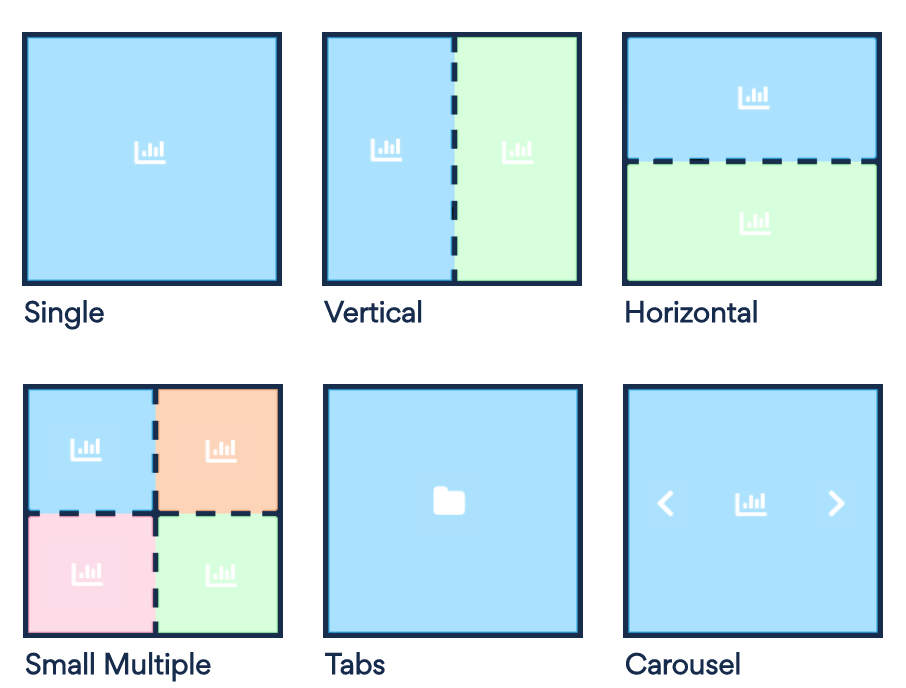
With Layouts you can combine multiple visualizations into split views, tabs or carousels to create even more engaging stories. This allows the readers to dig
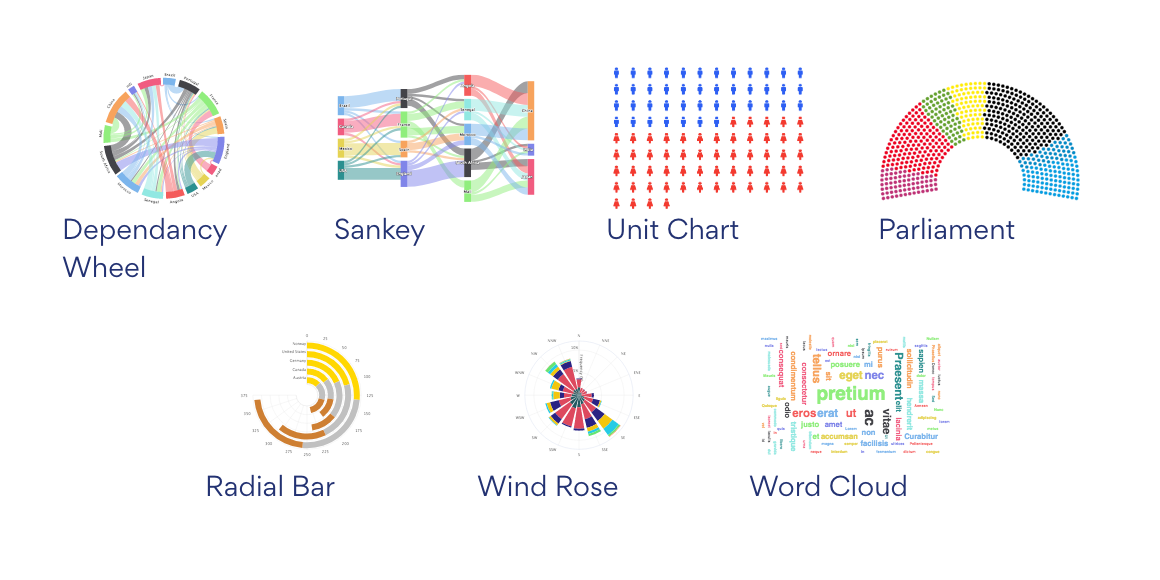
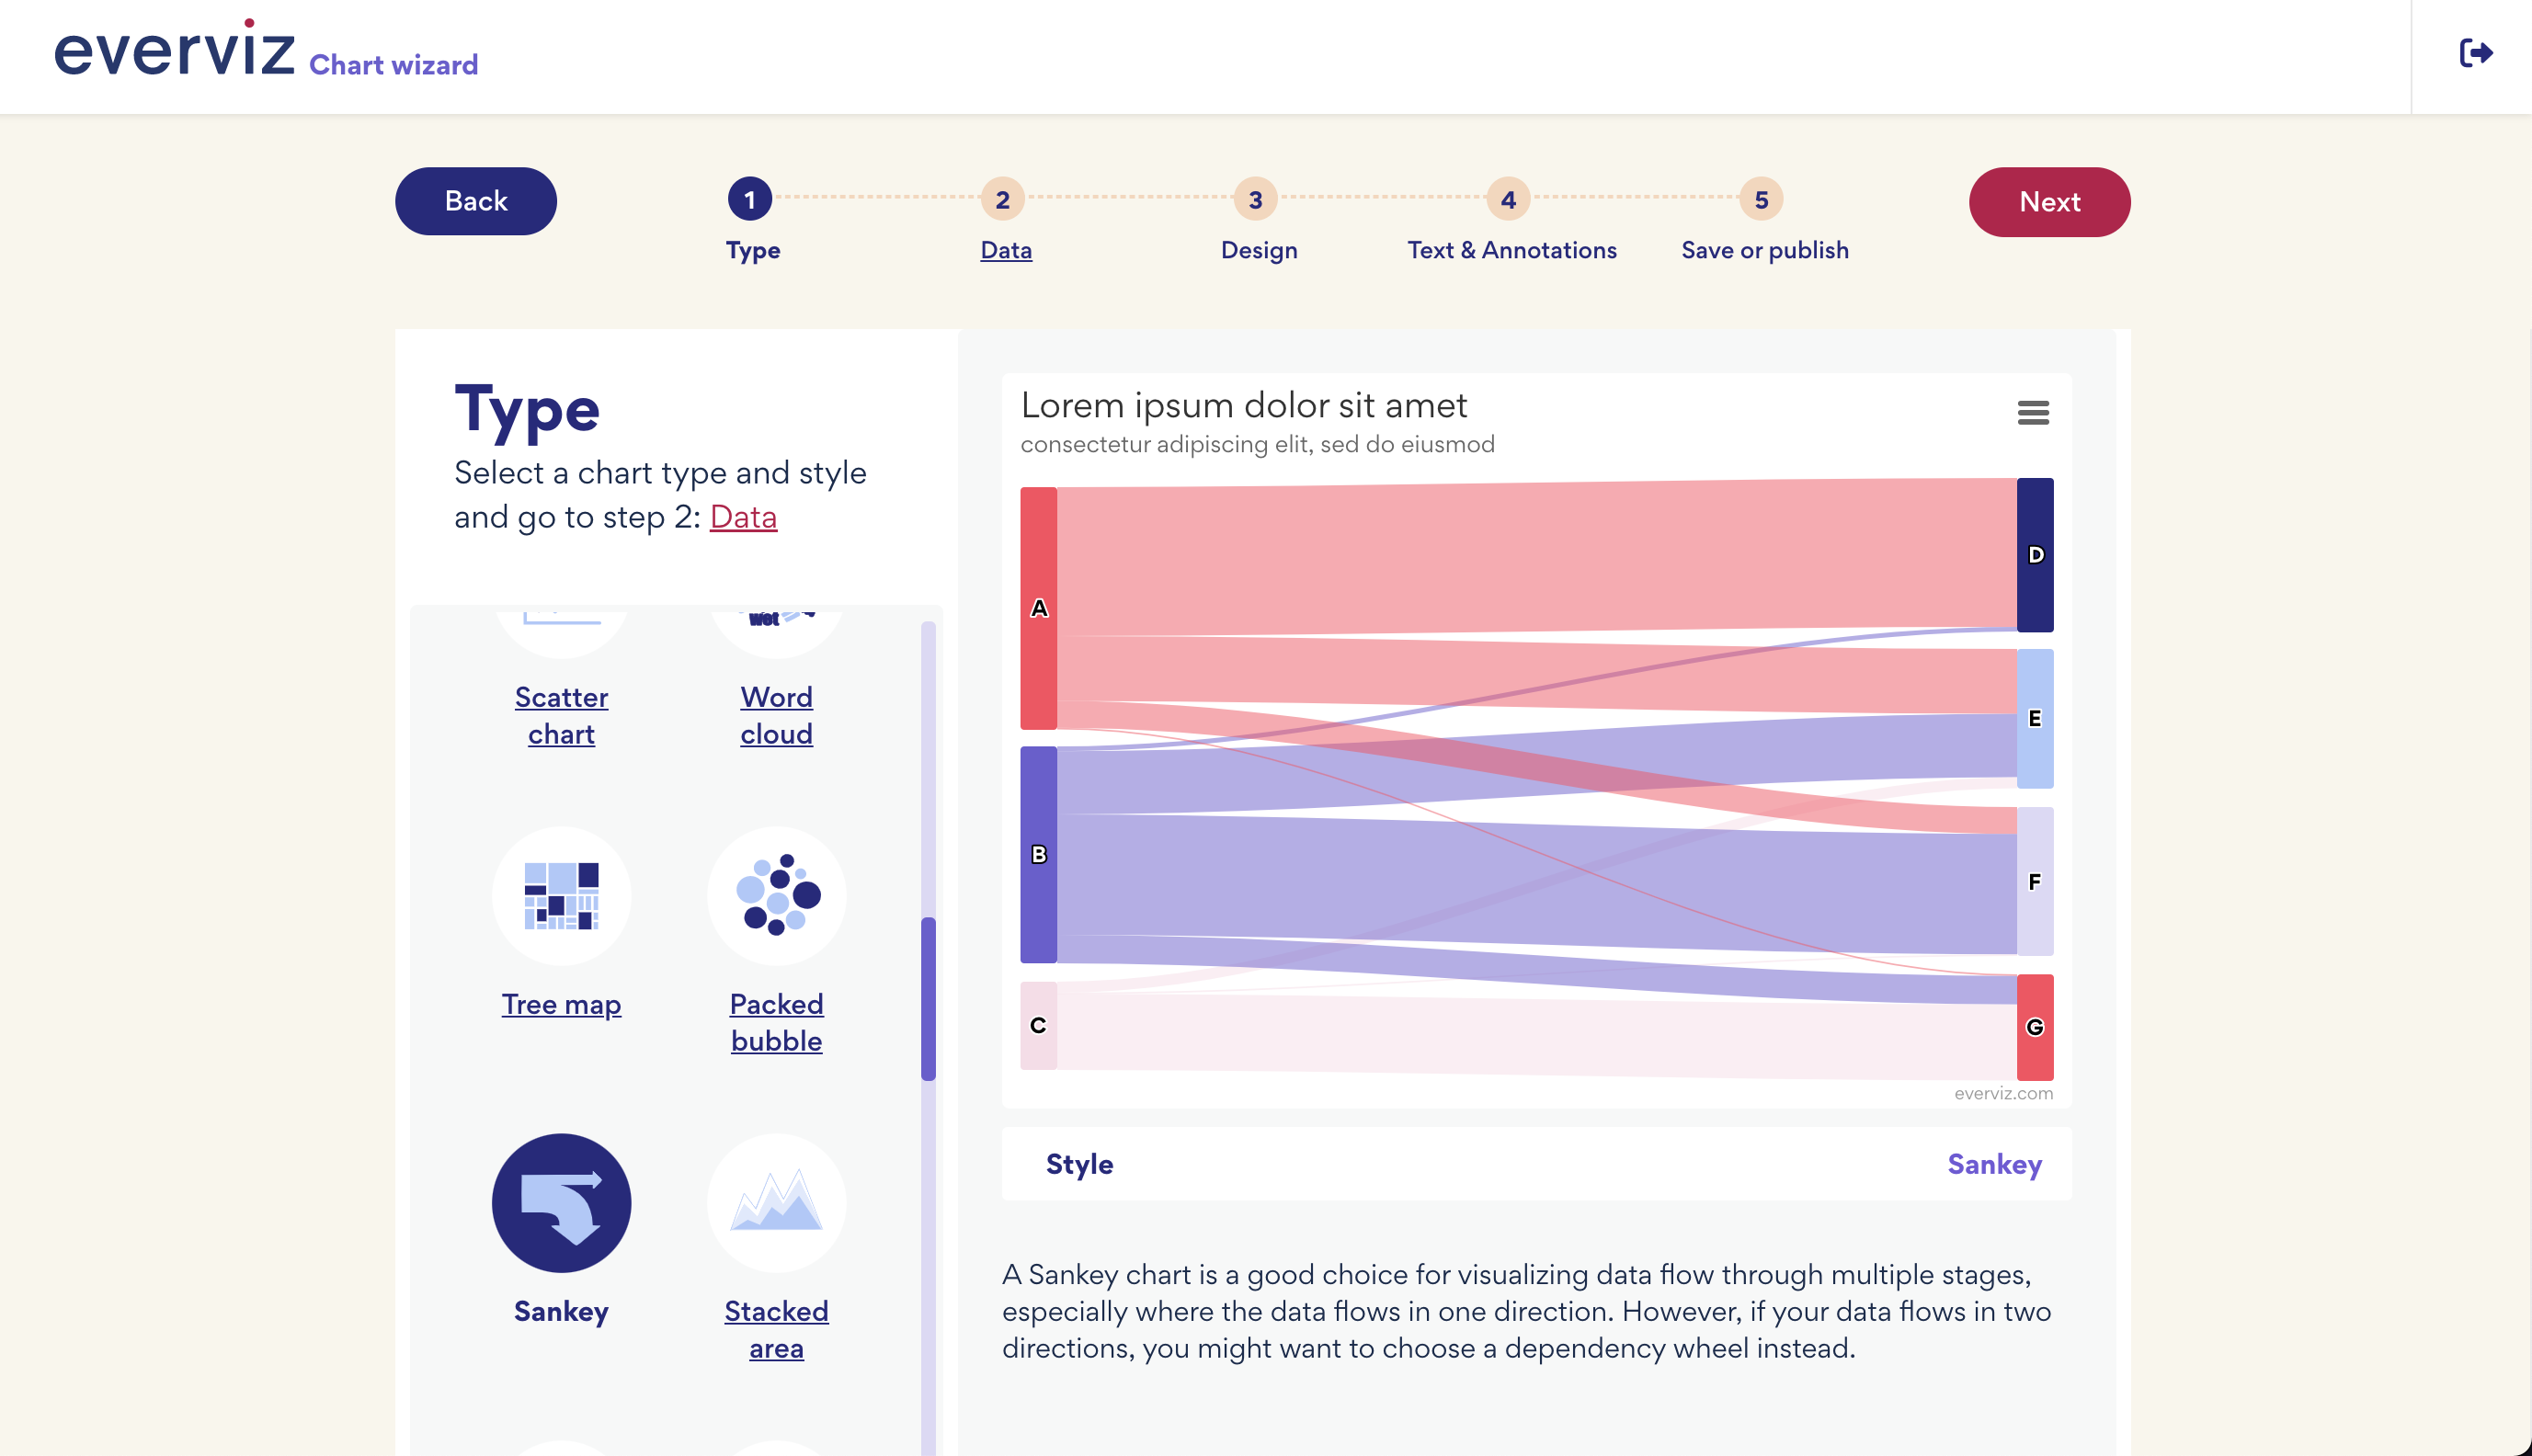
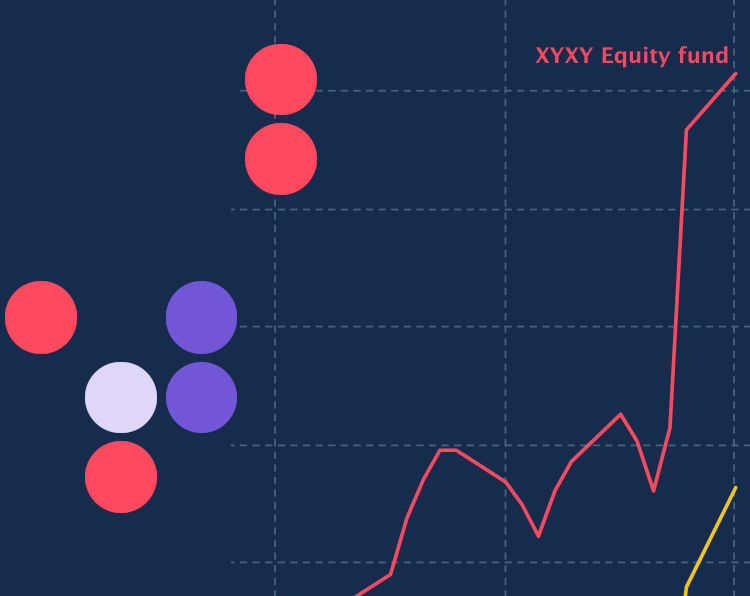
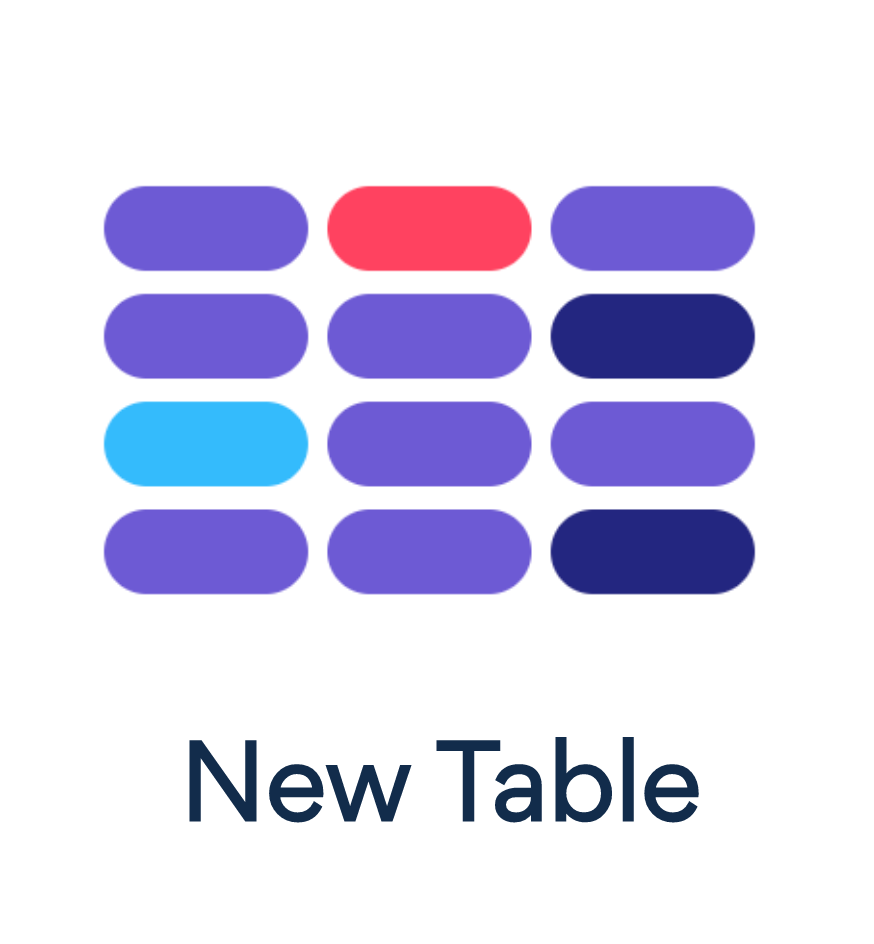
We have just added more chart types to everviz. Parliament chart, Word Cloud, Unit Chart, Sankey, Dependency Wheel, Radial Bar chart. Check it out! Check out some samples
Visualizations play an important part in making data digestible and turned into actionable insights. We are working day and night to enhance our service to
