At everviz, we aim to keep things simple, yet powerful. These are two orthogonal (independent) adjectives, and almost like describing something that is red, yet short. Still, we are continuously trying to find the perfect balance between a simple user experience and a powerful tool.
Our approach for balancing simple, yet powerful, is separating the most used features into a simple basic editor, and offering more comprehensive features in an advanced editor.
The feedback we get from our customers is that this separation is very useful and enables them to work productively. If the option is not available in the basic editor, it’s almost guaranteed that it is possible to get the desired results by tweaking the advanced settings.
Hence, another feedback we get is that it is hard to navigate in the advanced settings.
We have a few exciting updates coming up to deal with this challenge, and the first step is simplifying the navigation between the advanced features and the chart preview using the Inspector.
What is the Inspector
The Inspector is a feature in everviz that allows you to inspect and modify a visualization more easily in the advanced settings.
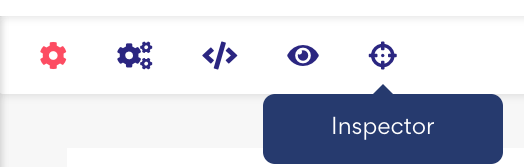
Accessing the Inspector from everviz is quite easy. All you do is head to the upper side of the editor and click on the Inspector icon
Now that the Inspector is activated, advanced view is loaded automatically, and you can use your mouse to hover elements in your visualization and navigate directly to the relevant section in the advanced editor.
How does it work ?
To show how the Inspector works, we are demonstrating the feature with a recent customer query.
The customer was using the Financial Stock template to visualize the development of a Stock ticker. The stock template comes with many interactive zooming functions and they wanted to turn off one of them.
To illustrate this example we have created a Stock chart using the Tesla Stock. After importing the data into the editor, the chart looks as follows:
The customer wanted to keep the buttons for zooming (1), but remove the capability for inputting dates manually (2). See screenshot below for illustration:

Achieving this result is an advanced feature as this is not something that will be done on a daily basis. However, knowing where to find this feature in the advanced view is hard.
With the Inspector, you can now find this feature much quicker.
- Enable the Inspector by clicking on the Inspector feature
This will load the advanced editor - Use your mouse to hover the field you want to change. The field will be highlighted
- Click the desired field
The Tree view on your left side of the editor will automatically open the relevant function, and you can play around with related advanced settings.
Coming up
Note that the Inspector is currently not connected with every advanced feature, but we will continue improving this feature as we go. As mentioned initially, we have other exciting updates coming up to make the advanced features easier to use as well. Stay tuned for more information.
If you have any questions or feedback about this feature, please feel free to let us know through the form below. Enjoy inspecting and exploring all the powerful features in everviz.