
The Telegraph’s inclusive approach to visualizing the news
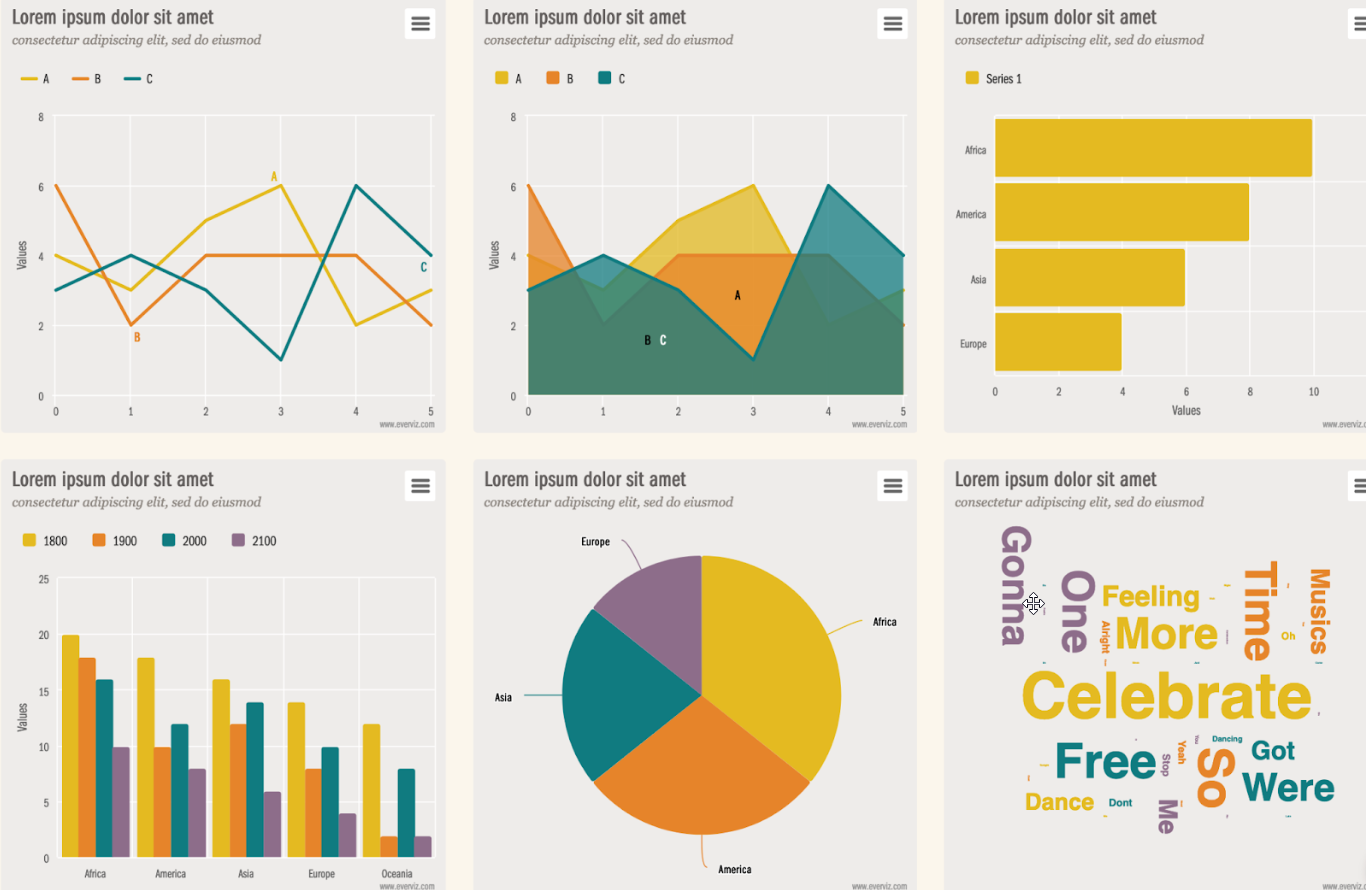
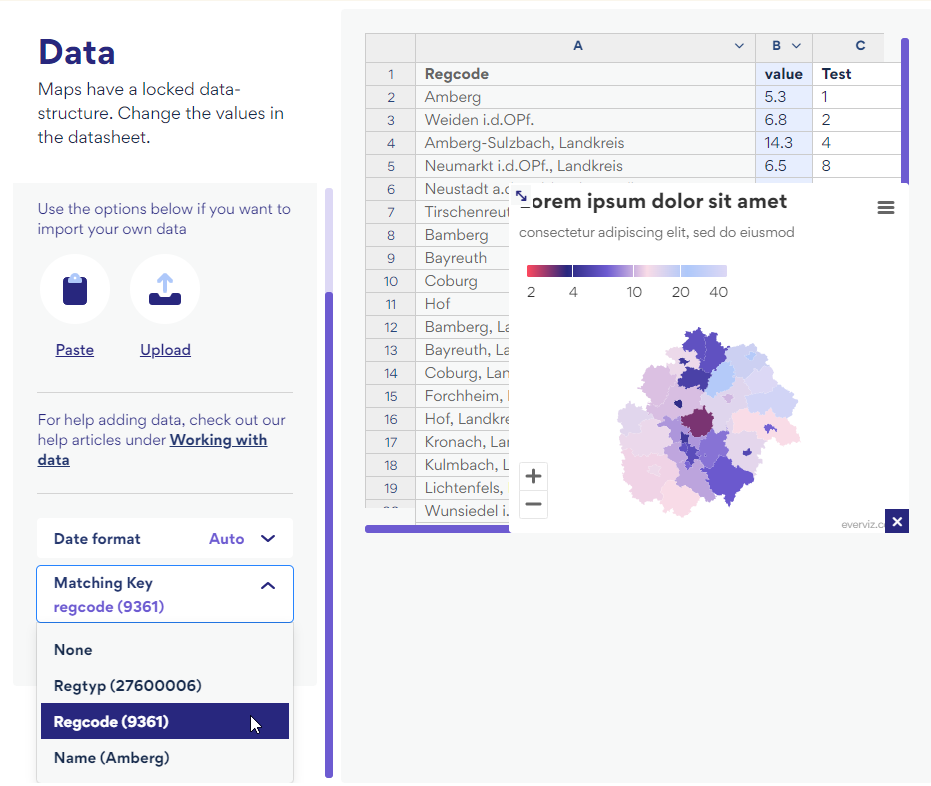
Simplifying complex information in news stories is key to reader engagement at The Telegraph. Charts and maps from everviz help readers understand at a glance
Simplifying complex information in news stories is key to reader engagement at The Telegraph. Charts and maps from everviz help readers understand at a glance

Video as an increasingly popular medium for conveying information. Our customers want to know – how do we make engaging videos with beautiful and relevant

The US election this November promises to be one of the biggest stories of the year. A data-driven event, where visualization of vote tallies stands

This is a featured blog post by Amy Cesal, Product Evangelist at everviz. A three-time winner of the Information is Beautiful awards, Amy is an

2023 was a turbulent year on the international stage. Conflicts in Europe and the Middle east dominated the news, as did reports of tension between

We are thrilled to announce our latest partnership with Polygon, a leading financial data platform, marking a significant milestone in revolutionizing the way financial data
This is a featured blog post by Amy Cesal, Product Evangelist at everviz. A three-time winner of the Information is Beautiful awards, Amy is an
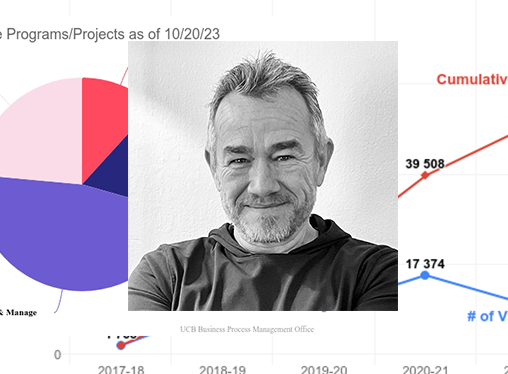
The University of California, Berkeley places high standards on their data visualizations. Charts must update in real time, satisfy web accessibility requirements, feature university colors
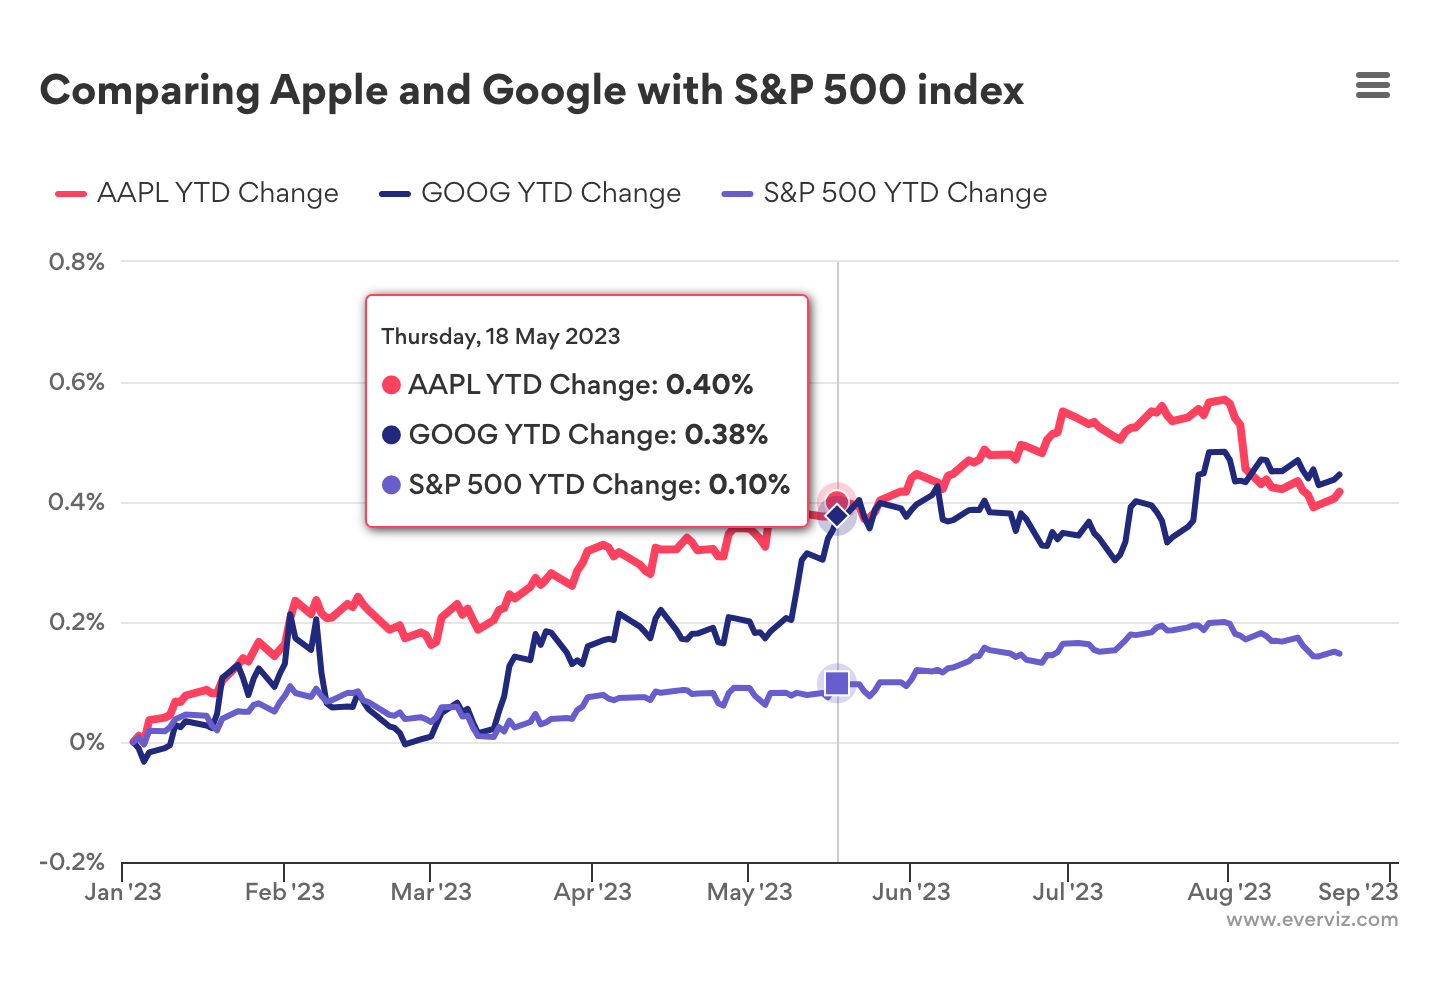
Introduction In this post, we’ll show you how to use the GOOGLEFINANCE function with everviz to create interactive charts and visualizations, and make the most
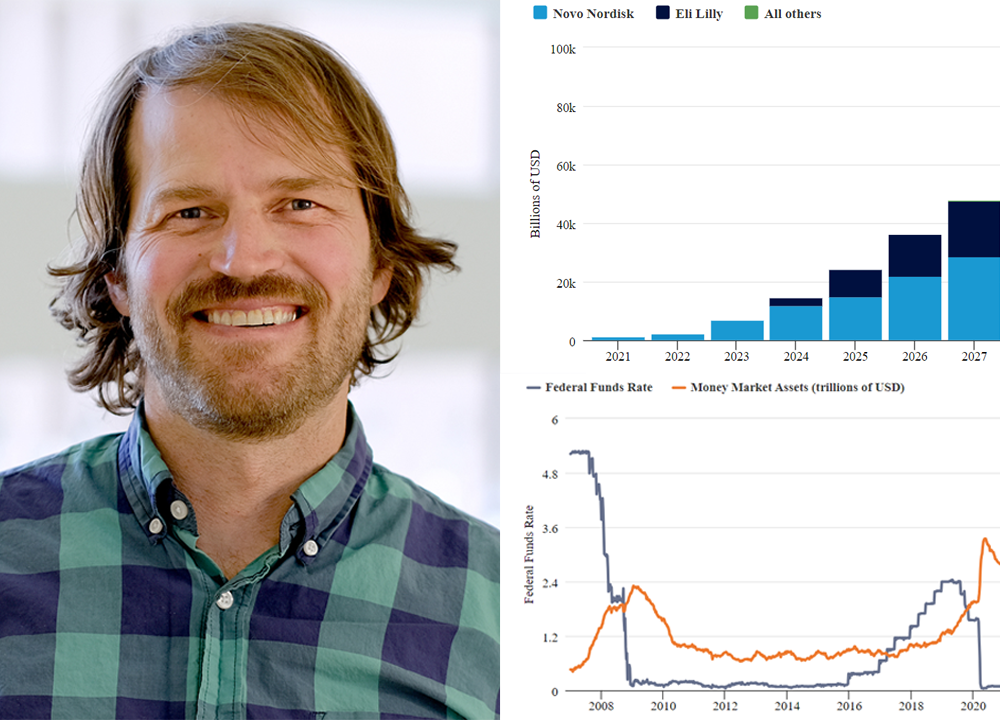
Charts are key to marketing efforts at Thornburg, a US-based Investment firm. Their thought leadership content is found on multiple platforms, including their website, social
We have some exciting new updates to share. Working with maps and multiplatform publishing just got easier. With the introduction of dynamic fonts, chart text
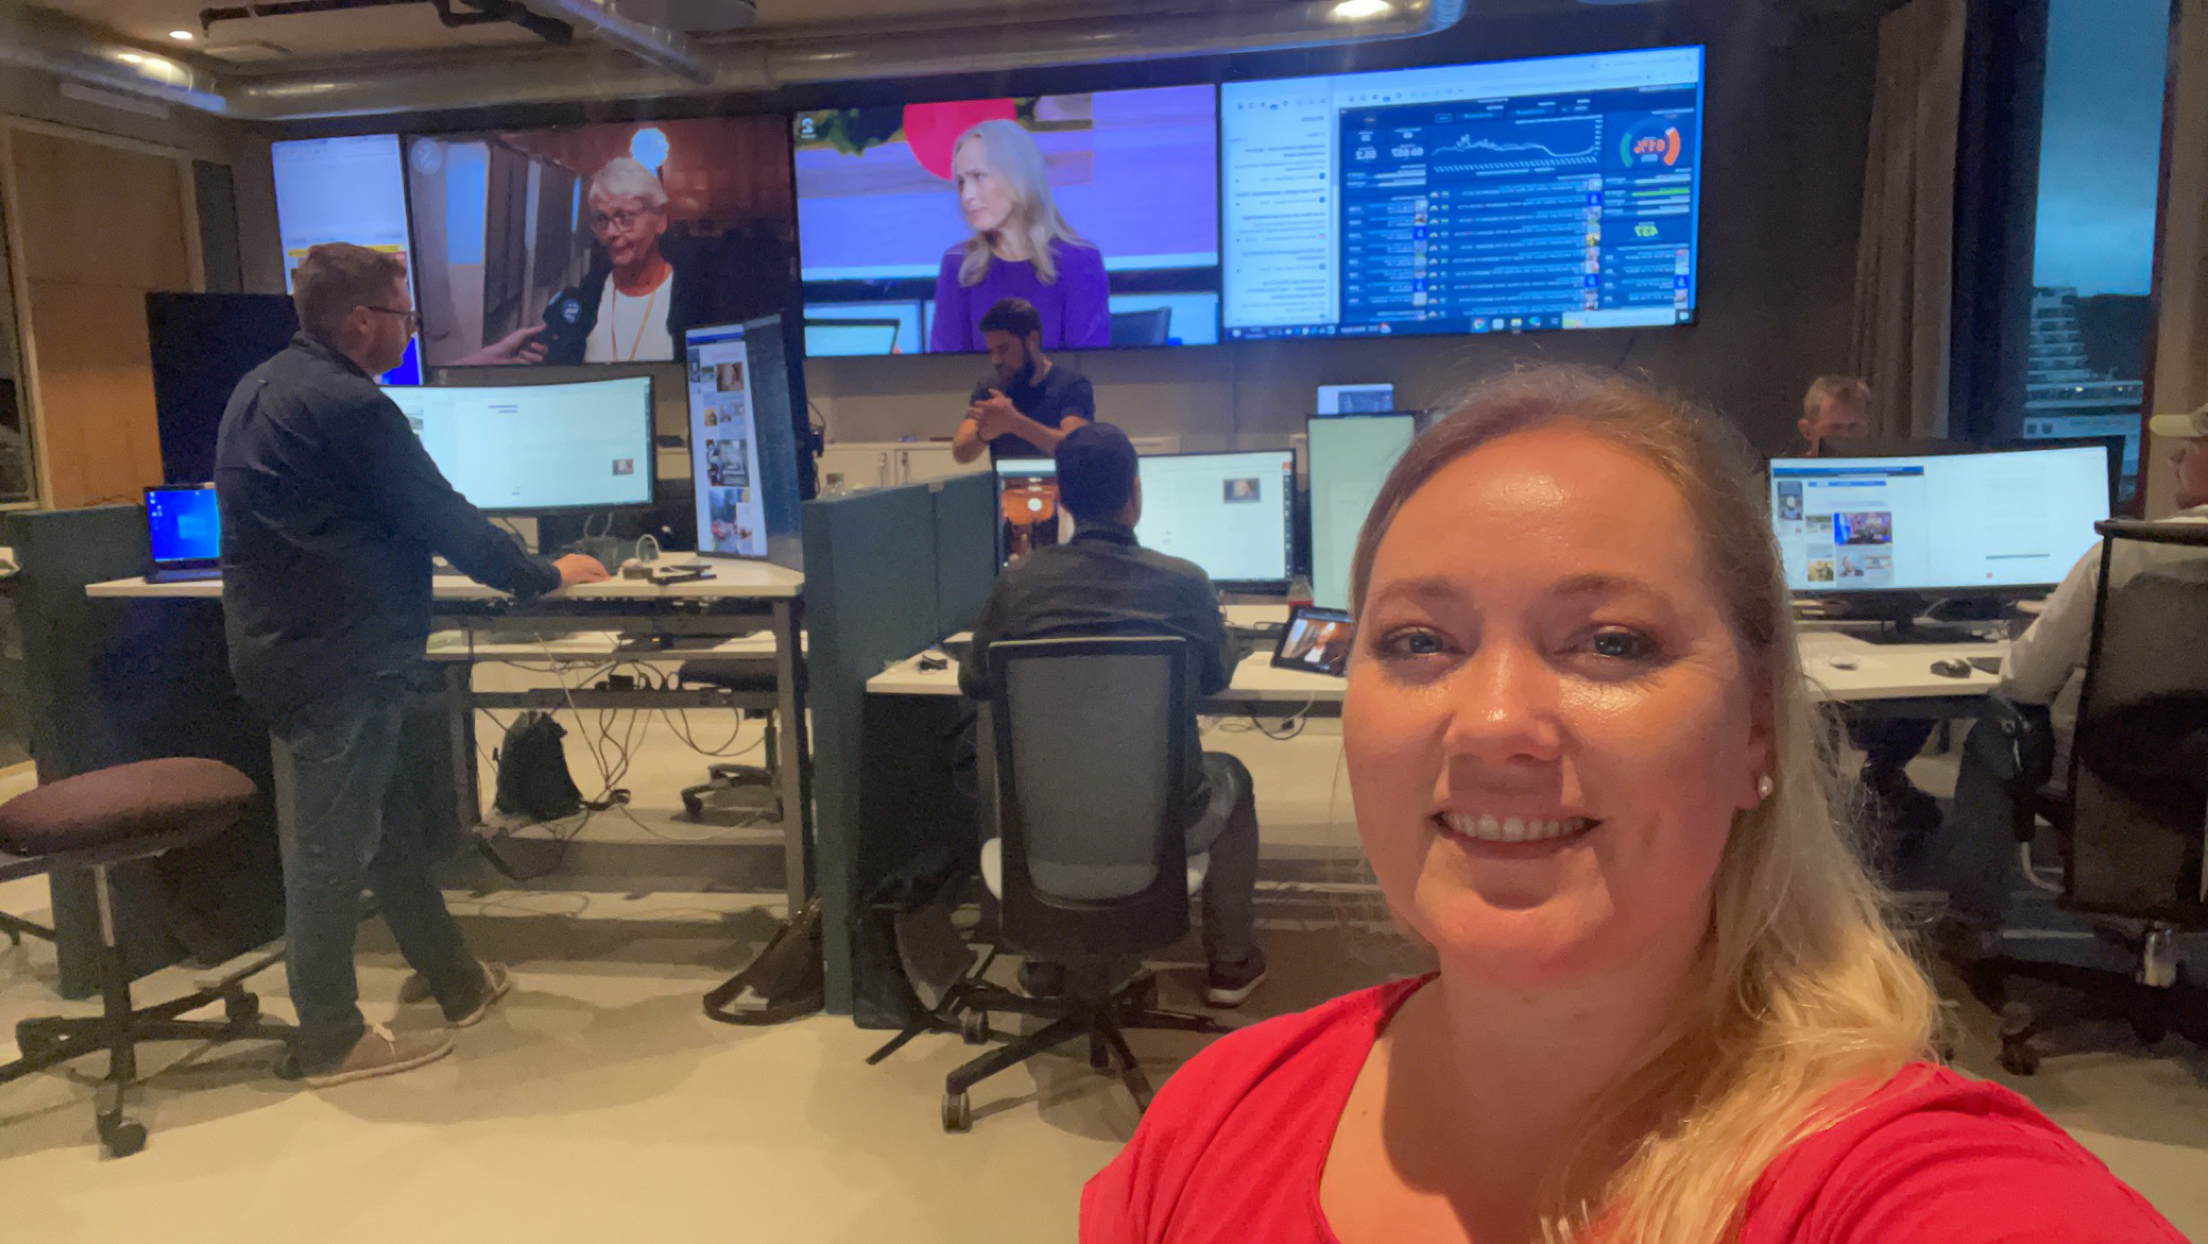
Something extraordinary marked this year’s election coverage at Sunnmørsposten (SMP) newspaper. For the very first time, data graphics enriched the live election night stream. Liv-Jorunn Håker,
