We have some exciting new updates to share. Working with maps and multiplatform publishing just got easier. With the introduction of dynamic fonts, chart text now auto adjusts to suit the publishing point. And everviz can now read map IDs, for example postal codes, when building a map. Read on to learn the details.
Scaling up, scaling down
For many of our clients, visualizations are integral to promoting products and establishing thought leadership across various platforms. Maintaining a consistent visual quality is essential for these endeavors.
Whether you’re exporting visualizations for the web, print, or video, our latest feature, dynamic fonts ensures that your text size seamlessly adapts to your selected export format.
Drag the lower right corner in the live demo below to see the effect in action.
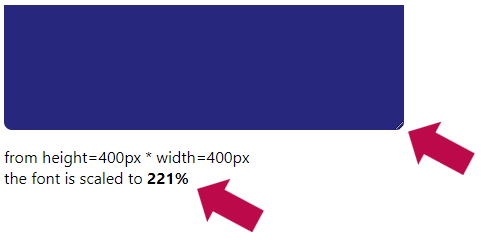
Live demo
This innovation is particularly noticeable when exporting visualizations in video format, where text size requirements differ significantly from those of an online article.
More identifiers added to maps import
You can now create maps based on code IDs.
Everviz reads these code IDs, which can represent municipality or postal codes, from your data set. everviz will utilize these codes for map creation.
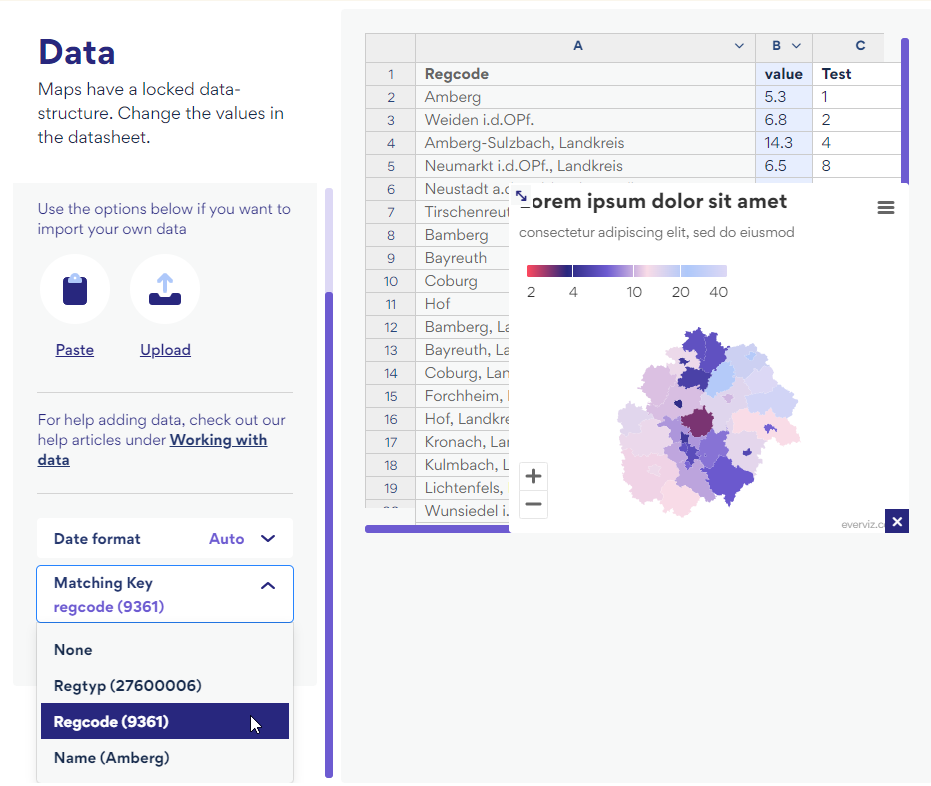
The new Matching Key menu enables using map IDs such as postal codes to build maps, in addition to region types and names.
This is a significant upgrade from the previous method of building maps solely based on region names within your dataset.