Why everviz?
Visualizations communicate information universally, quickly and efficiently.
No matter what insights you want to share with your audience, visuals motivate your audience to continue consuming your story, and leaves your reader with a better understanding of the topic.
everviz empowers teams to create engaging visual content with ease
- Easy tool with little to no learning curve
- Drive engagement and impress your audience
- Repurpose your visualizations on all platforms
- Gain audience trust and loyalty
- Maintain brand consistency with custom colors, fonts, logo and other styling
- Reach a larger audience with state-of-the art accessibility features
- Collaborate with your team
- No technical constraints
- No code or design skills required
- Time to market is key! Meet your deadlines
- Download your work to be printed for use in static reports or presentations
- Ties perfectly into your current publishing workflow
Paste, pick and publish
Paste
Enter data directly, drop a CSV file into the editor, copy & paste from Excel, or connect to live data.
Pick
Our intuitive editor lets you choose chart type, edit text, fonts and colors to make your data stand out.
Publish
Publish on your website, social media, print material or through your cloud-based newsroom system.
Responsive everywhere
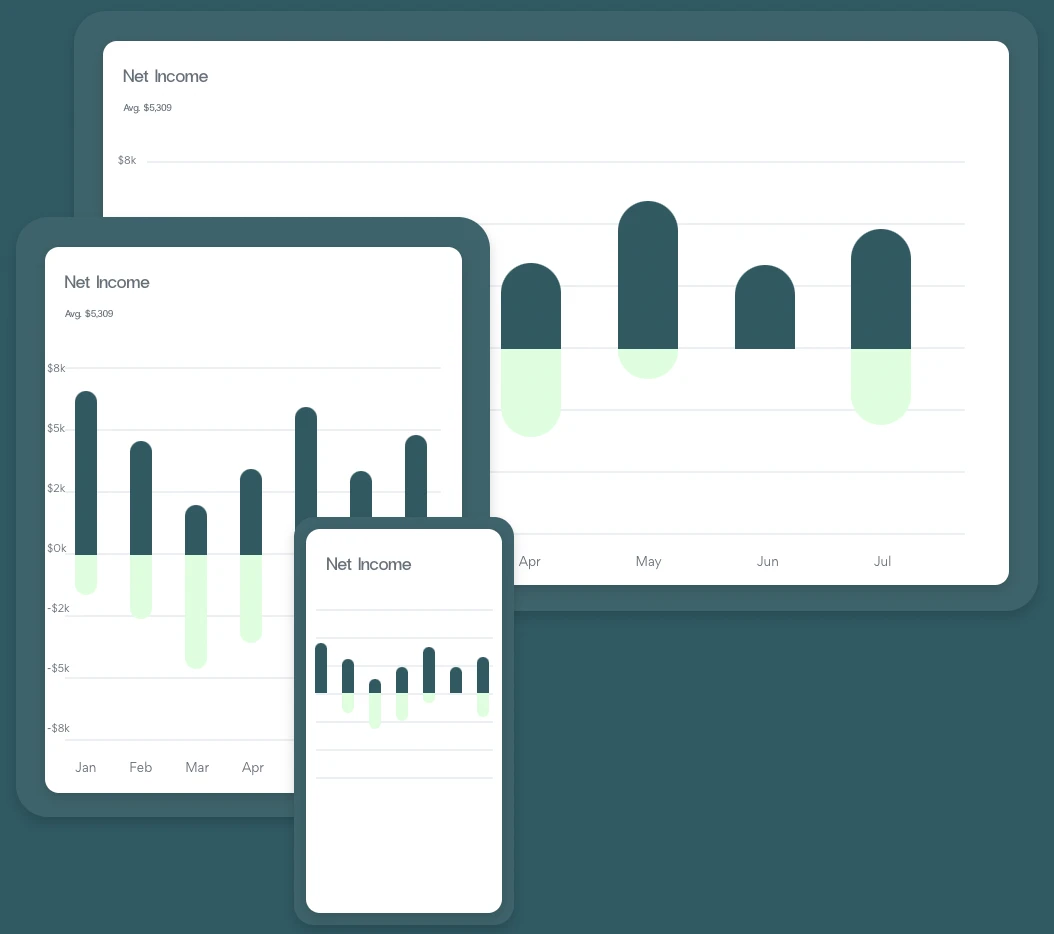
No need to create different charts for different devices. Every chart is intelligently re-configured to each visitors’ desktop, tablet or mobile screen size, and will smoothly justify information to make it readable for any user.


Everyone collaborate
Team accounts provide groups with customized workflows, shared workspaces, galleries, and design templates for consistent branding.
No more visuals spread around in shared drives or local desktops. everviz is a one-stop cloud solution. You can work from anywhere, anytime.
Branding is everything
Each piece of visual content you create represents your brand and affects your brand perception.
everviz comes with a simple and powerful Theming concept, which allows you to incorporate your corporate brand design into charts, tables and maps. Include custom colors, fonts, logo and other styling options.
- Upload Custom Font
Abc
Abc
Accessibility for everyone
Our mission is to enable our customers to reach out with content, news and insights to the largest possible audience. This means accessibility is crucial to our platform and business.
All projects created with everviz include state-of-the-art accessibility functionality in the three most relevant disability categories for visual charts: vision impairment, motor impairment and cognitive impairment. Read more about the unique accessibilities in everviz here.
everviz adds accessibility compatibility to your projects automatically, and you will enjoy increased consumption of your content instead of worrying about accessibility regulations.
CMS
Works with your current Content Management System (CMS)
Adding an interactive visualization in your CMS is easier than adding an image. Ties perfectly into your existing publishing flow. Try before you buy if you want full guarantee.
You are in good company.
- everviz’s flexibility, depth of features and responsive customer support make it a really powerful option for communicating our advice.
- Luke Maxfield, Climate Change Committee
- everviz is an important part of our journalism and allows us to easily produce engaging data visualisations on our platforms. The tool is easy to use and is a valuable resource across the newsroom.
- Gary Payne, Director of Content Strategy, The Telegraph