With everviz, you will have a variety of different choices for visualizations. We’ve just added another simple yet detailed and insightful visualization to your toolbox: Packed Bubble chart
What is a Packed Bubble chart
Packed Bubble, also known as Circular Tree Map or Circle Packing, is great for visualizing hierarchical data as nested circles of different sizes and colors. Each circle represents a level in the data hierarchy, with the color of the circle corresponding to an attribute and the size determined by a metric value.
With the Packed bubble, readers can quickly and easily spot patterns for even large datasets – The example below identifies most valuable brands from Top 100 within Automation, Financial Services, Media and Technology:
Please note: All the samples in this article are interactive. Drag and drop and hover the bubbles to explore the interactivity
How to create an interactive Packed bubble Chart
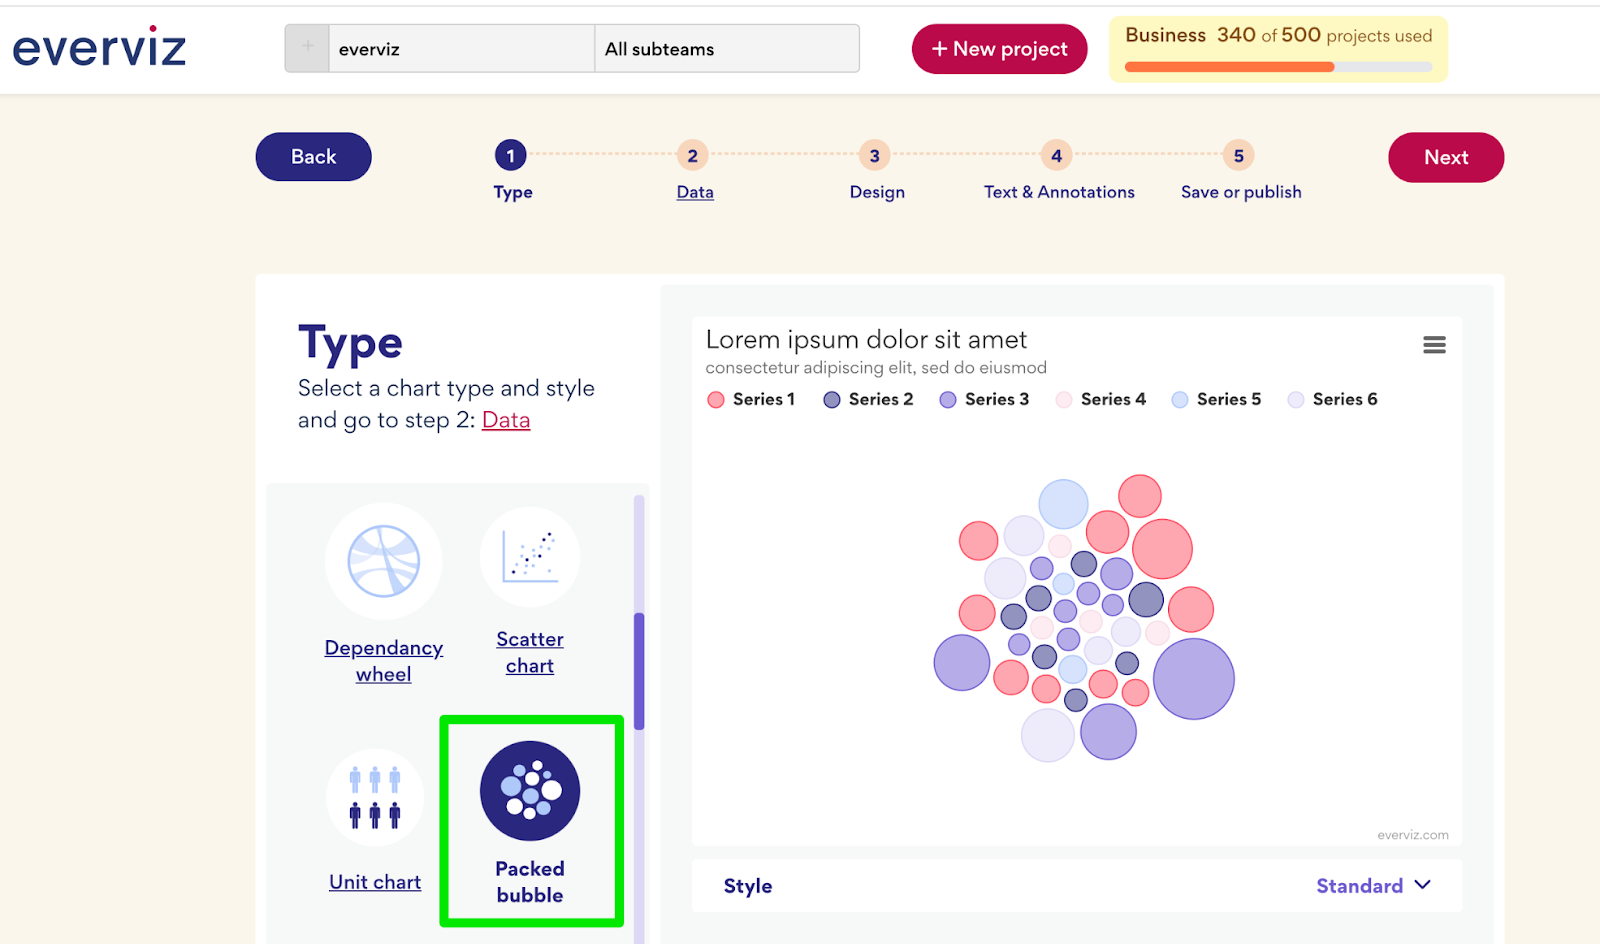
To Create a new Packed Bubble chart, click on New Project, and select the Packed Bubble template
Grouping the bubbles
It’s worth noting that if only one level of hierarchy is shown (no encapsulation), it becomes a barplot. It employs a circle instead of a bar to display the value of each individual value.
However, the Grouping feature comes in very insightful when organizing data into subgroups.
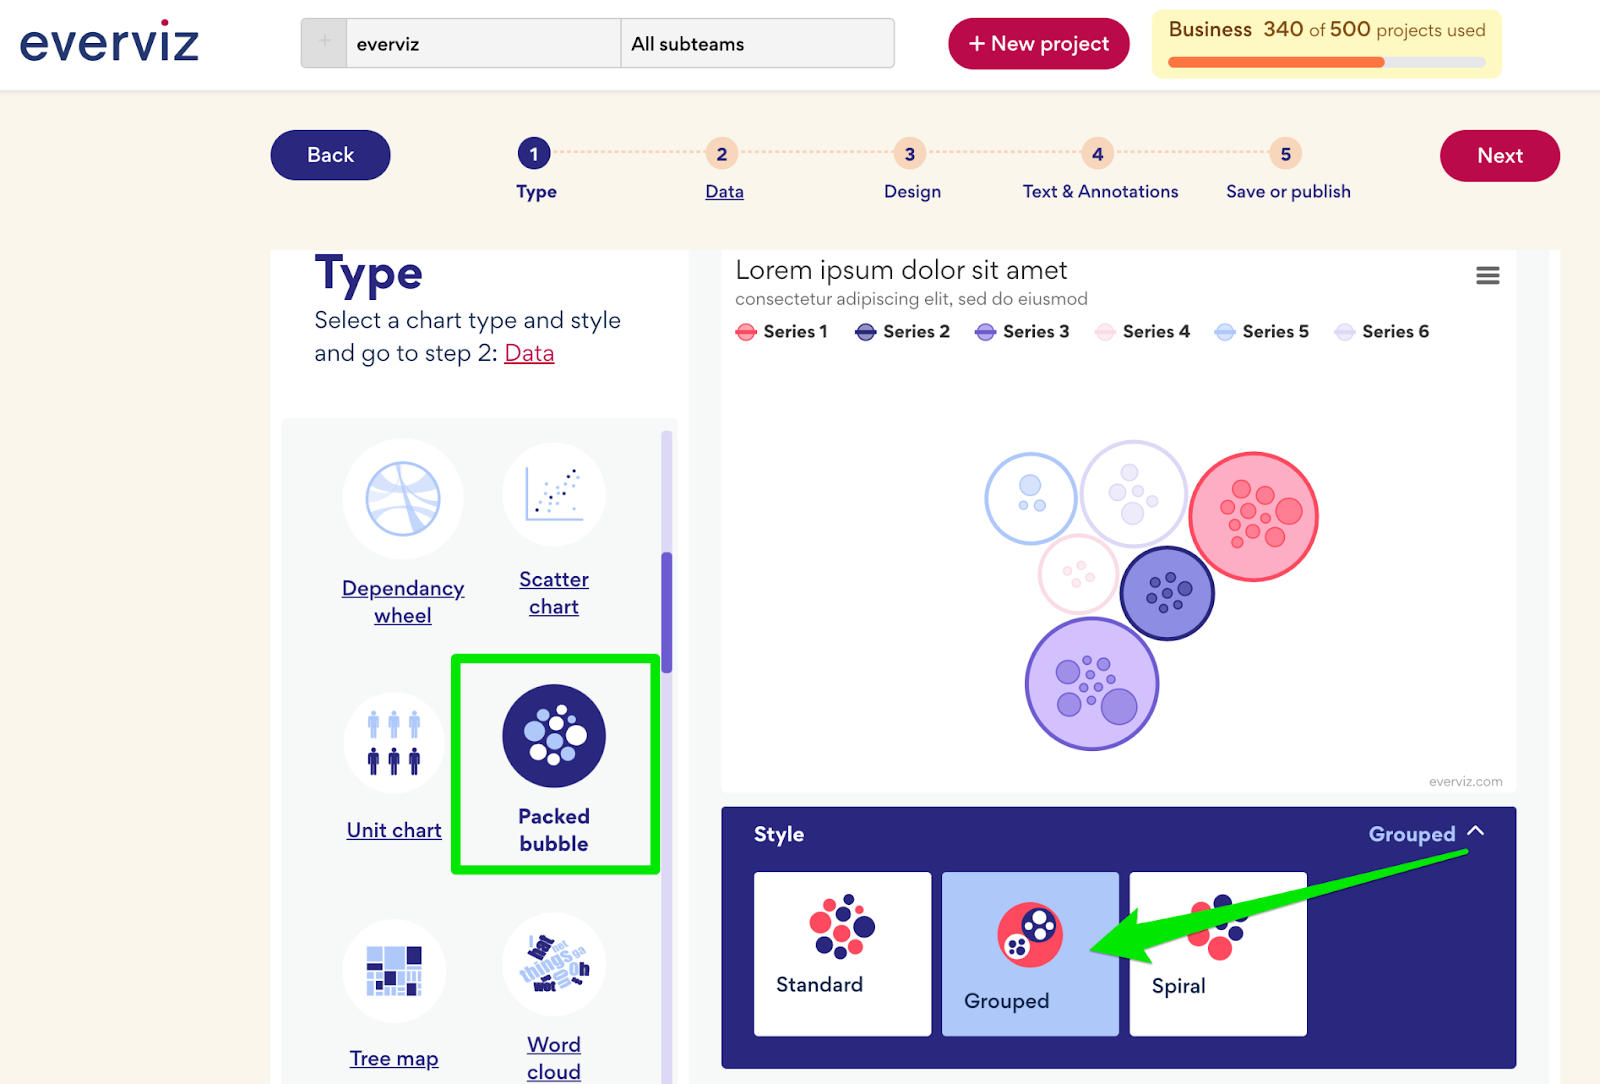
To Create a new Packed Bubble chart with grouping, click on New Project, select the Packed Bubble template and then choose Grouped from the Style dropdown.
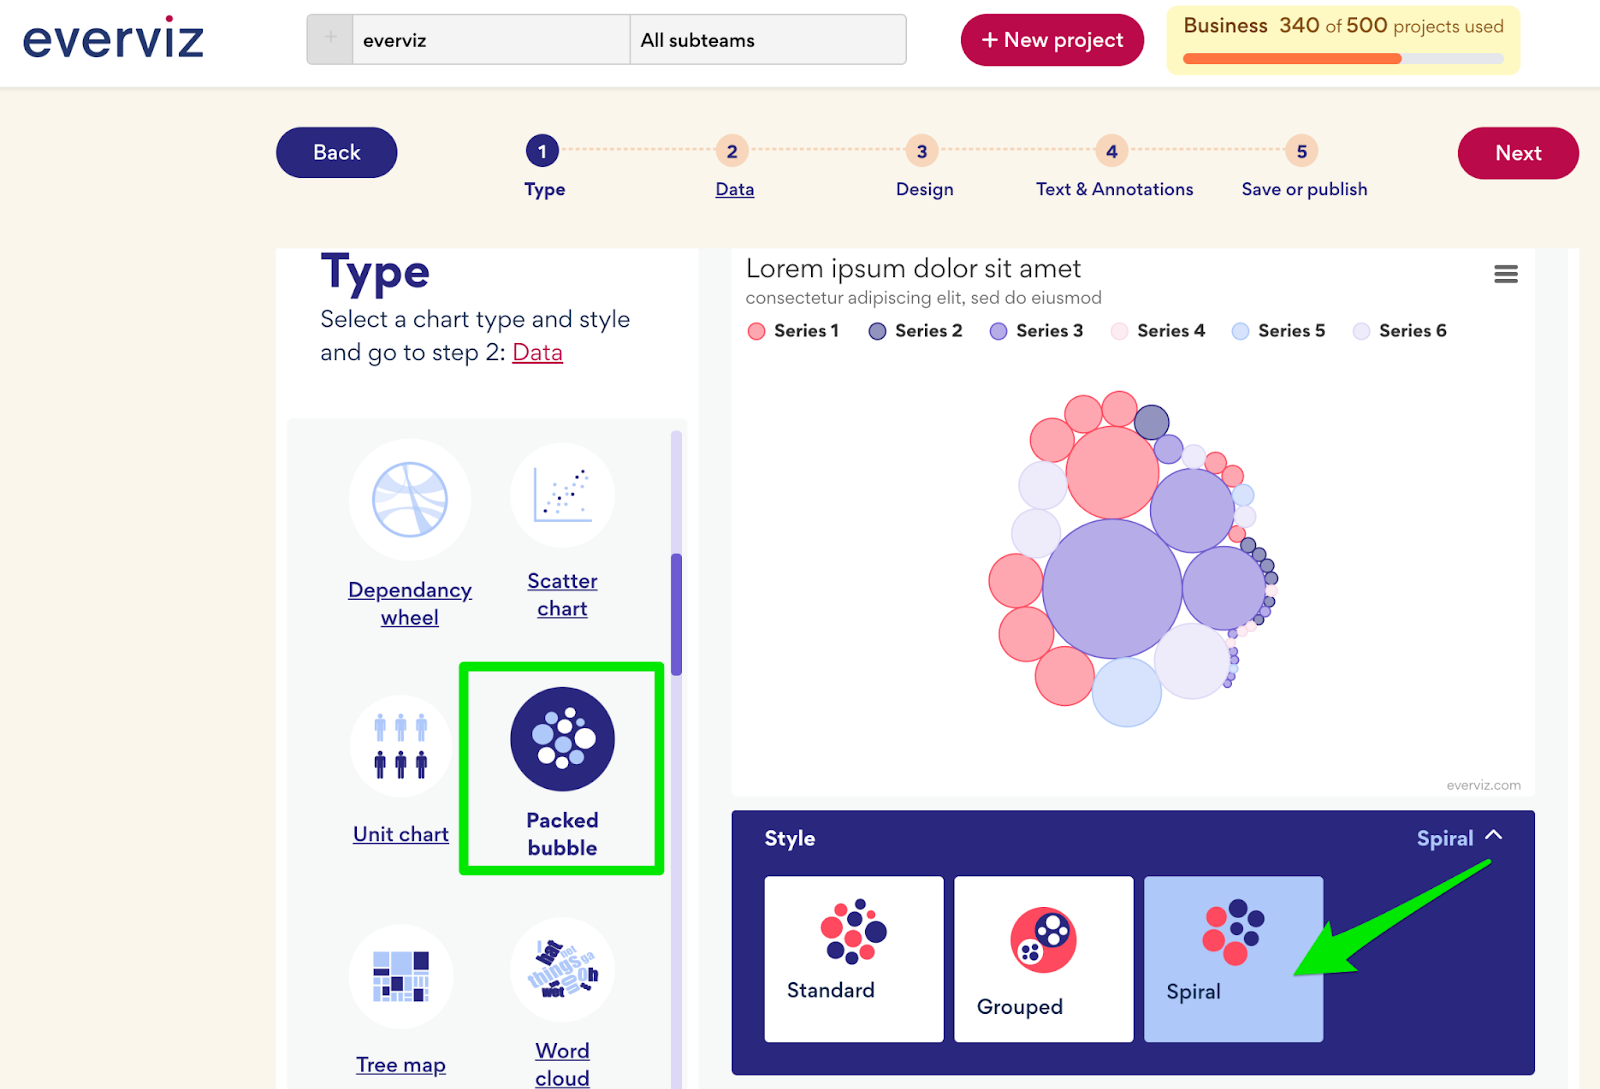
Packed bubble chart with Spiral design
Another nice feature for the Packed bubble is to show each bubble in order based on value using a spiral design.
To create a new Packed Bubble chart with the spiral design, click on New Project, select the Packed Bubble template and then choose Spiral from the Style dropdown
We would love to hear your feedback and see the amazing visualizations you create. Please get back to us using the form below
All the best,
The everviz team