Over the last couple of months, we have made some massive improvements to the editing experience in everviz. This article dives a bit deeper into the improvements and explains how you can use them.
Updated Project wizard
Chart types
The project wizard walks you through creating a data visualization in a few simple steps. Start by selecting the right visualization type for your data and finish by publishing your engaging visualization to your audience.
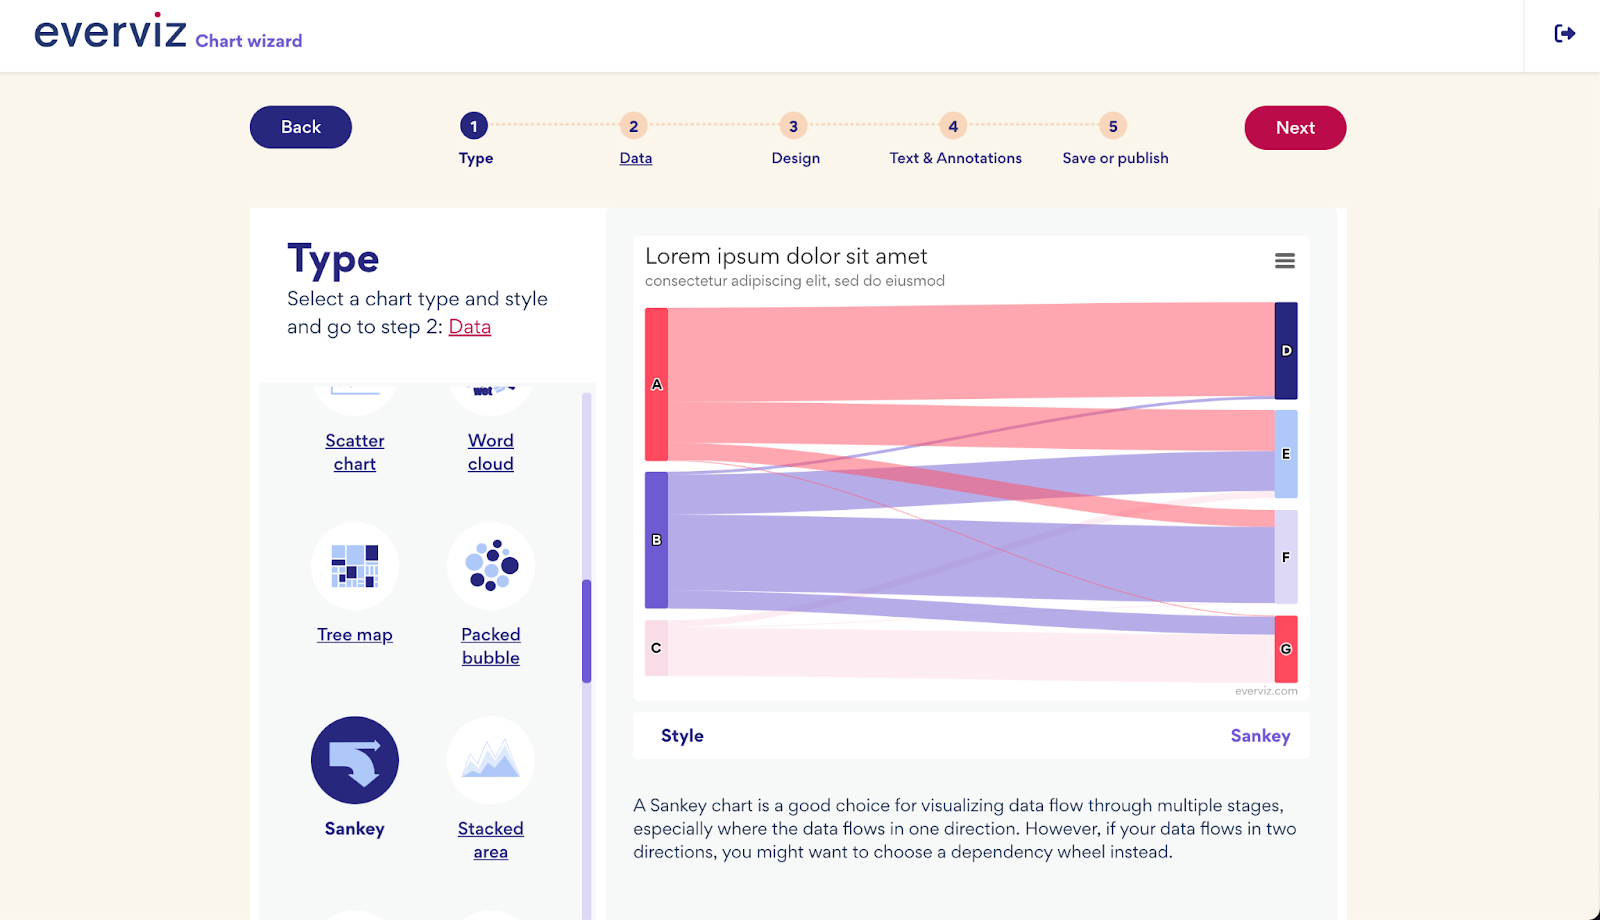
In the first step, you now get a preview of the selected visualization type to help determine its suitability for your data and story.
Adding data
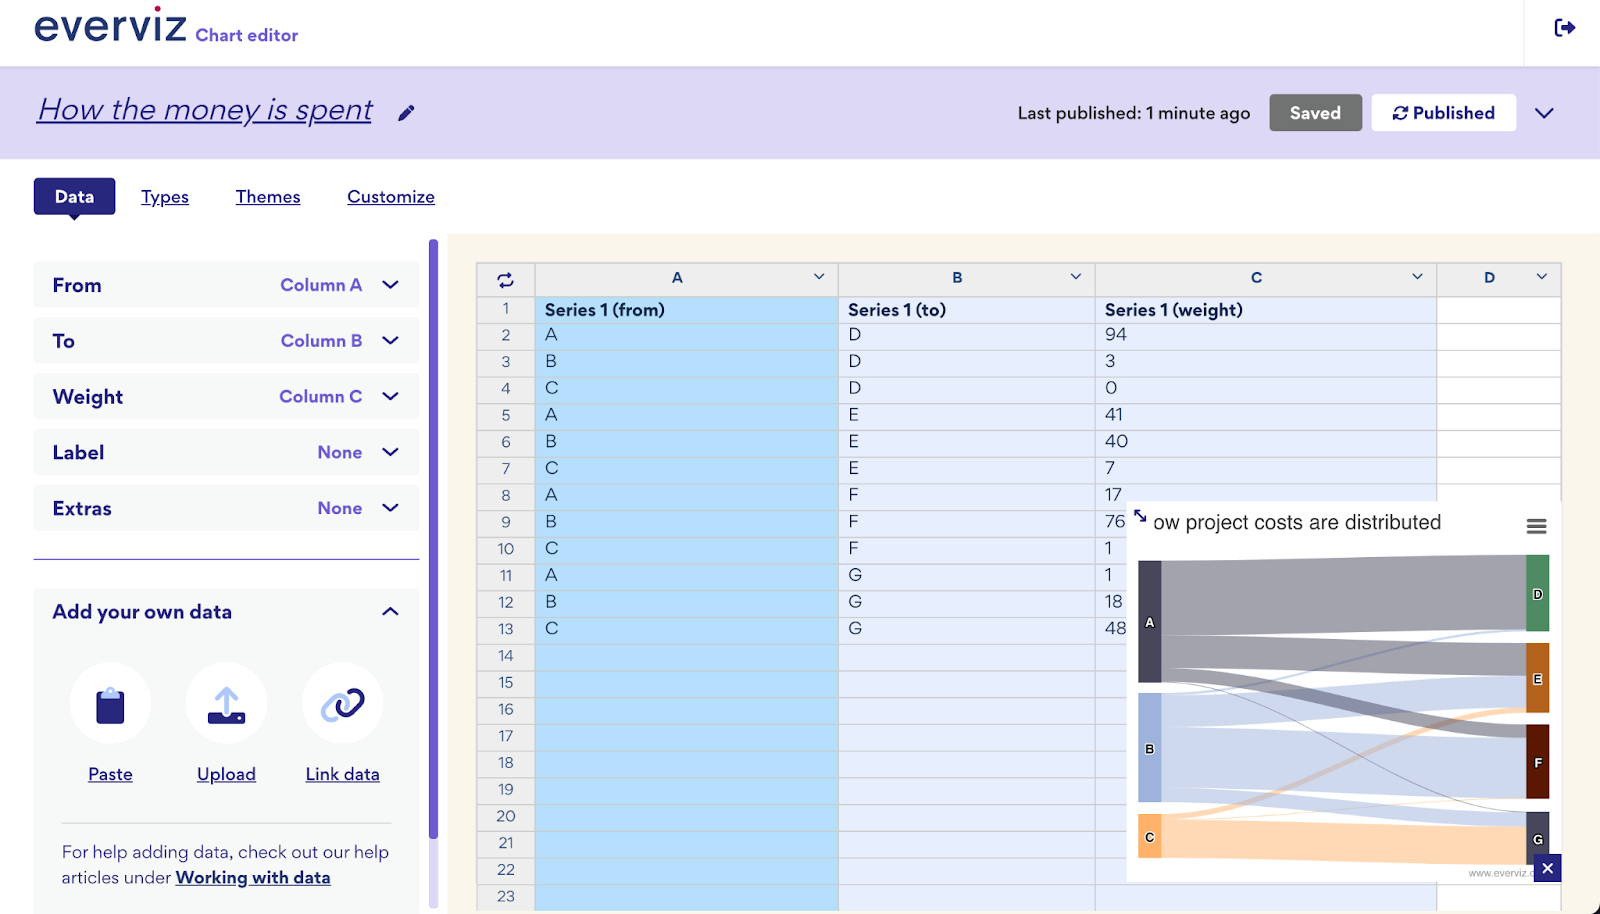
Another major update to the project wizard can be found in the Data step:
Data for the selected visualization type is shown to provide a better understanding of the required format. When adjusting the data by plotting manually or importing files, the preview of your visualization adjusts accordingly.
For more information on how to use the Project wizard, read more in our Knowledge Base.
Editors
The project wizard is great for quickly creating visualizations in a streamlined process, but everviz also provides powerful editing tools for charts, maps, tables and layouts.
All of these editors have gone through a massive overhaul in the last couple of weeks.
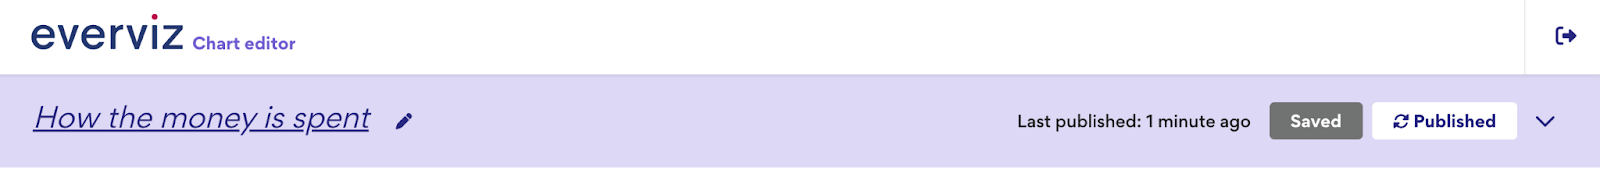
File information bar
The new file information bar, found at the top, provides some context around the project you are currently editing, and you can easily go from here to rename your project and publish your work to your audience.
Read more in our Knowledge Base.
Data
Our intention with the changes was that working with data should feel like working in any type of modern spreadsheet software. It should also be easier to understand the relationship between the data and the visualization. We’re very happy about the positive feedback we have received so far, and it seems like we’re on the right track.
The screencast below shows a line chart with three different series. Notice when hovering over the different series, the corresponding data and line in the chart is highlighted.
Learn more about working with data in our Knowledge Base.
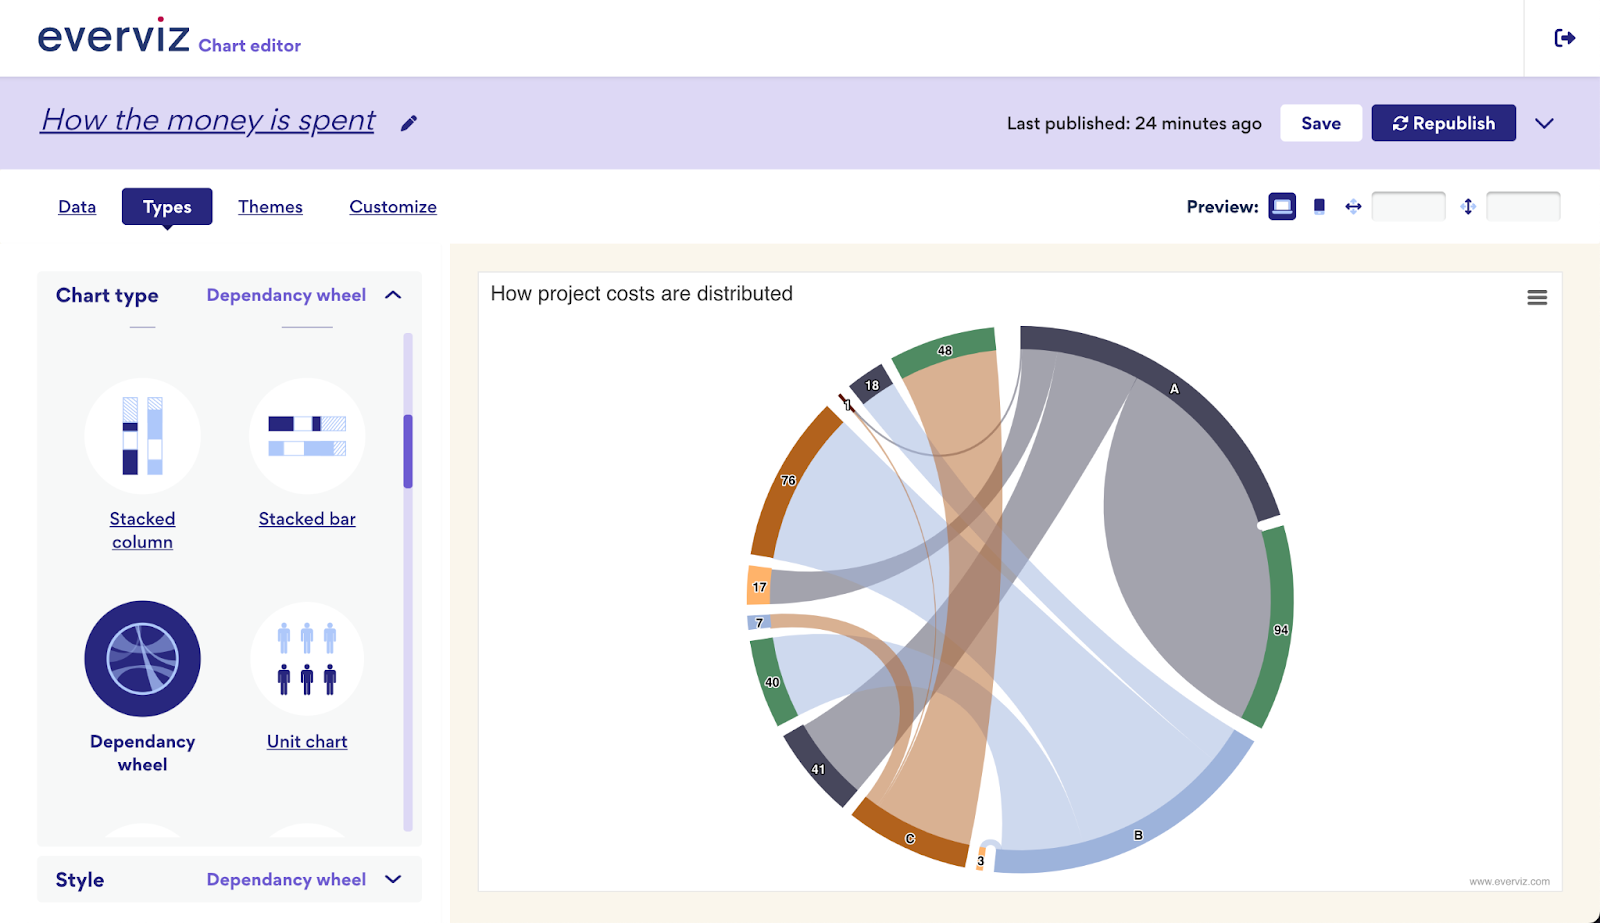
Change visualization type
In the Types panel, you can try other chart types to see if there’s a better choice for your narrative.
Apply custom Branding
Under Themes, you can choose one of your custom templates to incorporate all your brand styles into the chart
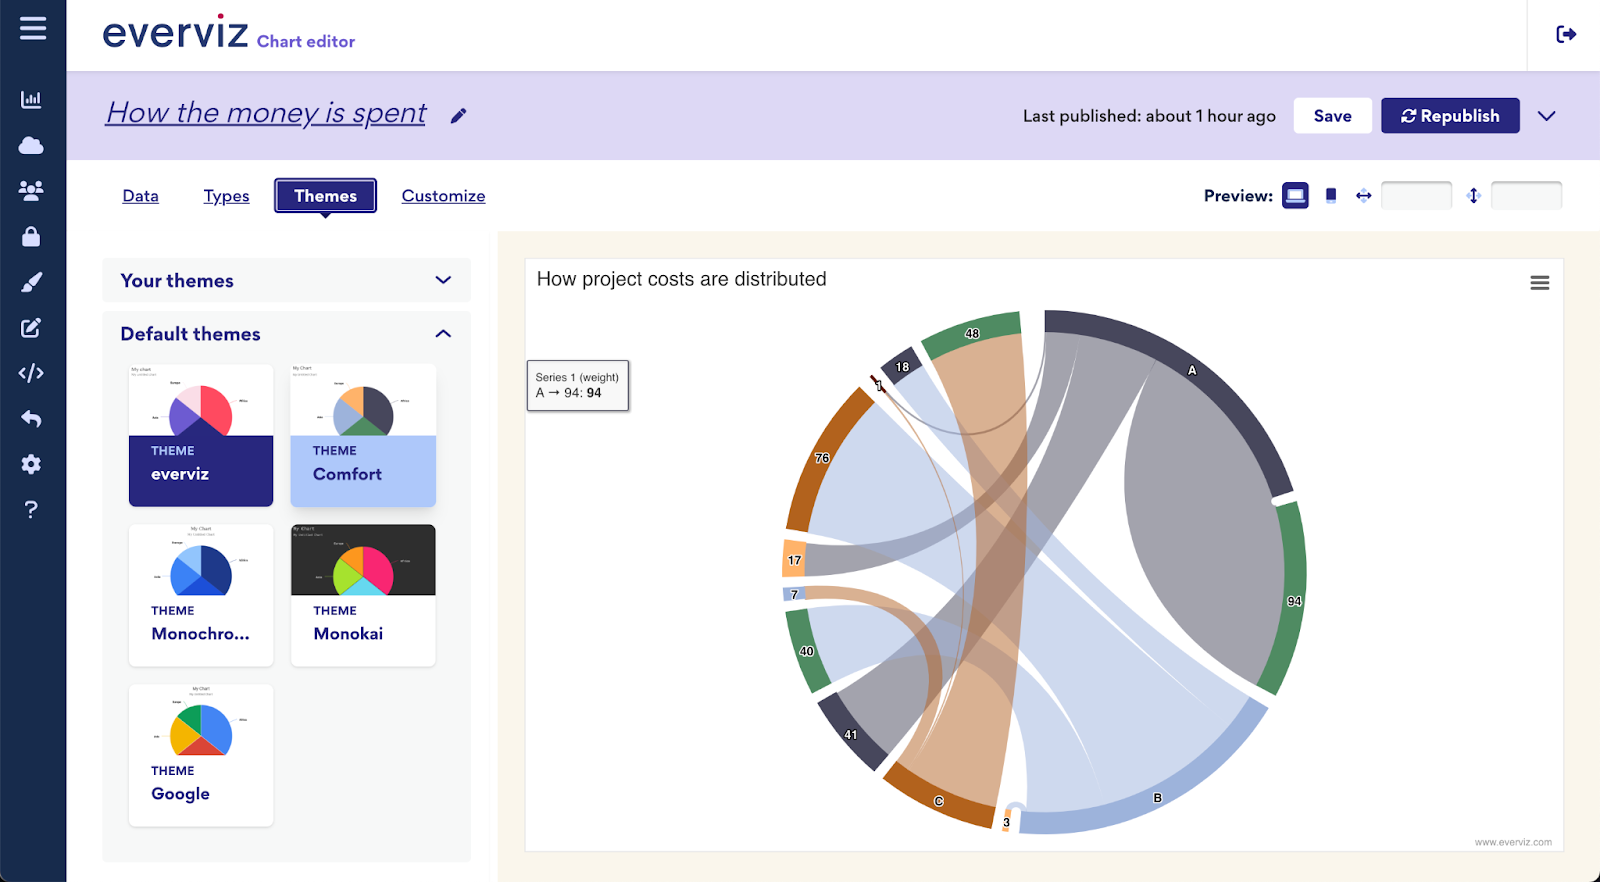
Learn more about Themes here.
Customize
The customize panel gives you all the power you need to adjust your visualization to your exact desires. We have done quite a lot of UI improvements to make each of the input fields more user friendly and consistent.
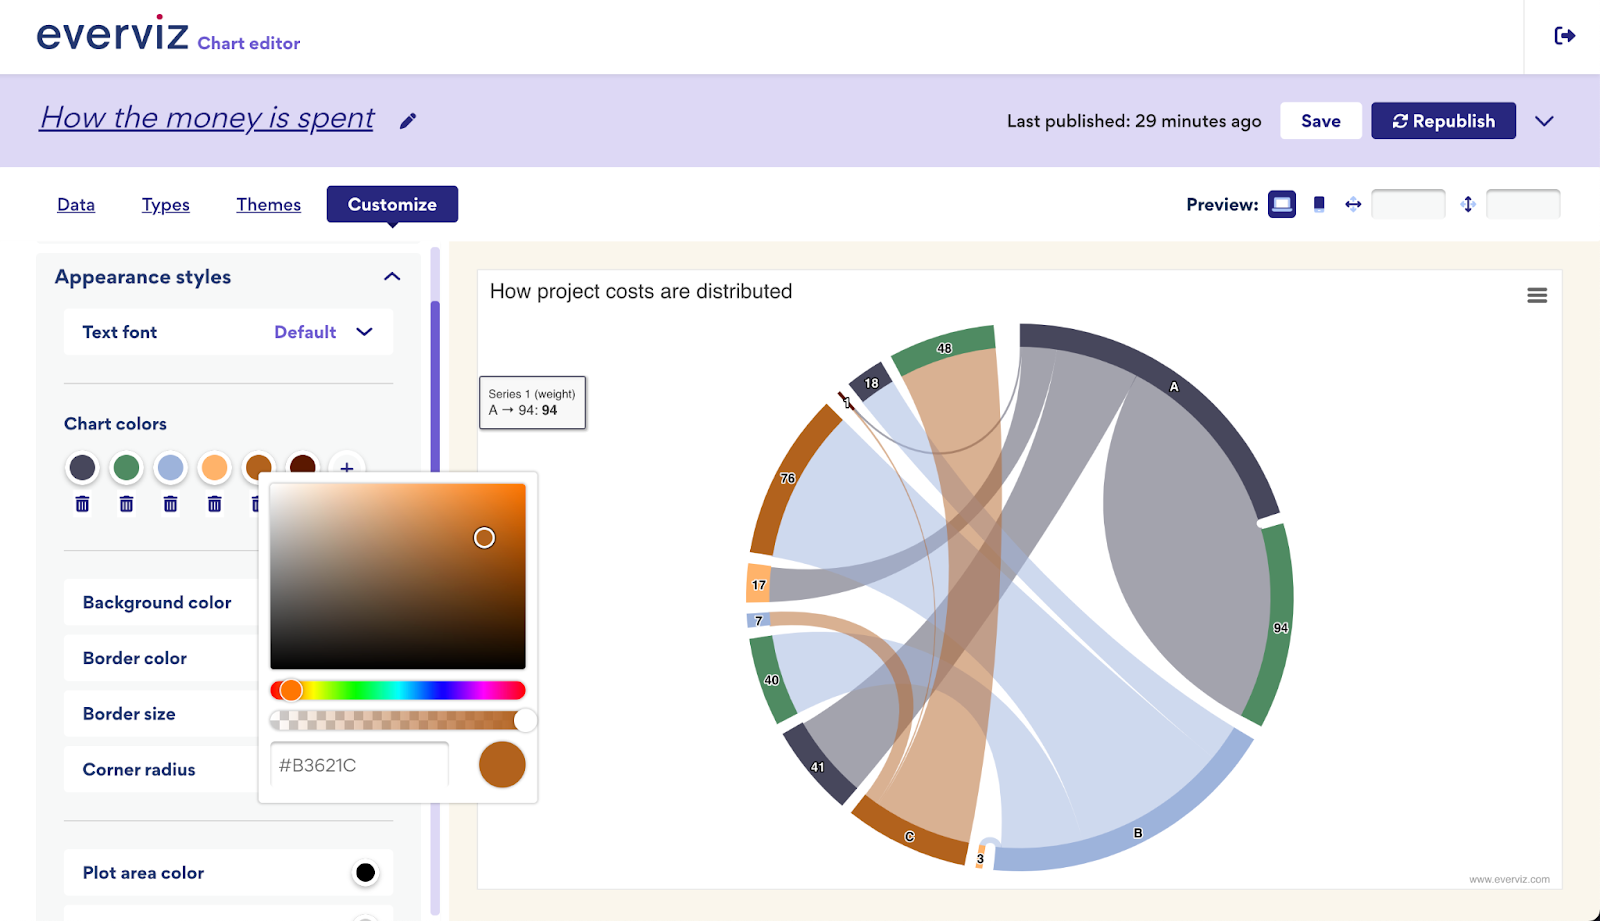

You can read more about customization in this help article.