We are excited to announce the introduction of a new chart type to everviz: the Treemap
What is a Treemap?
A Treemap displays data as a set of nested rectangles. Each group is represented by a rectangle where the area is proportional to its value.
When to use a Treemap?
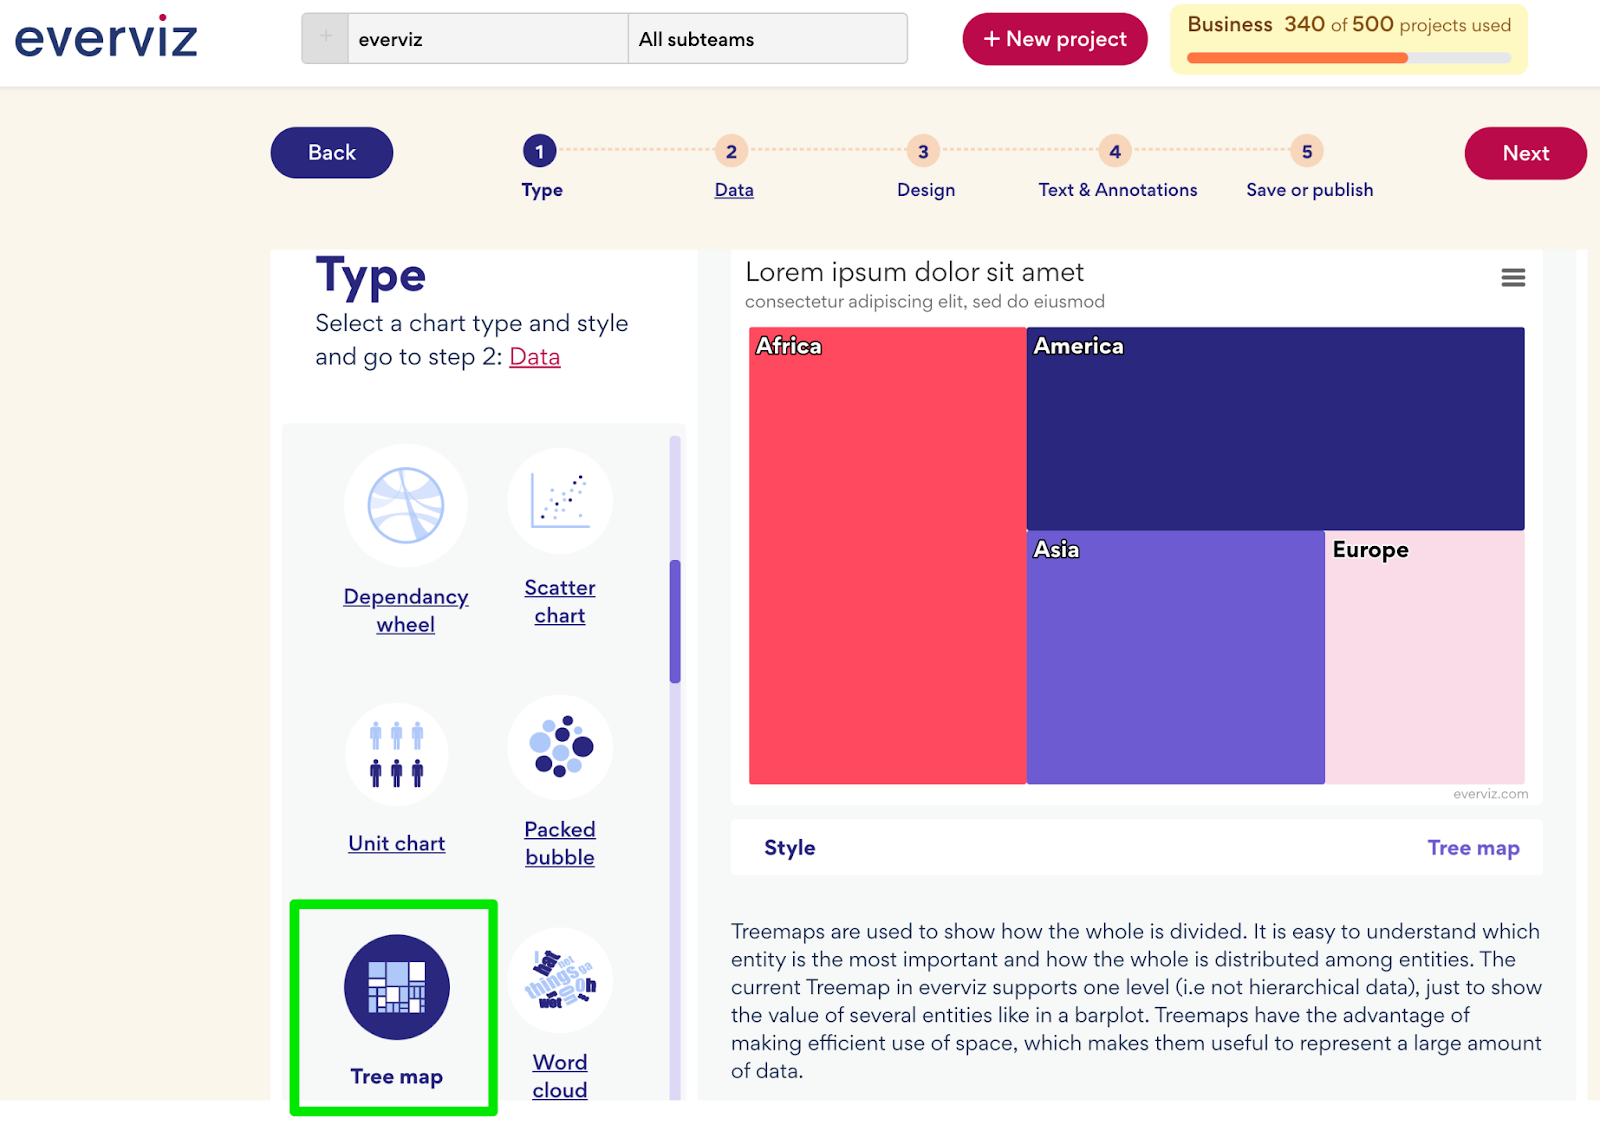
Treemaps are used to show how the whole is divided. It is easy to understand which entity is the most important and how the whole is distributed among entities. The current Treemap in everviz supports one level (i.e not hierarchical data), just to show the value of several entities like in a barplot.
Treemaps have the advantage of making efficient use of space, which makes them useful to represent a big amount of data.
Creating an interactive Treemap in everviz
To Create a new Treemap chart, click on New Project and select the Treemap type.
Upload your data and choose your desired design and share your visualization with your audience.
Using Adobe Illustrator®? Get more Treemap inspiration from our friends over at datylon, who offer a powerful chart maker plug-in for Illustrator®.
If you’ve got any feedback or suggestions for improvements, please let us know using the form below:
All the best,
The everviz team