Adding texts to your visualizations is now simpler than ever.
With the latest update of everviz, you now have access to editing all texts in your chart in one single page
Here is a screenshot of the new text panel in action:
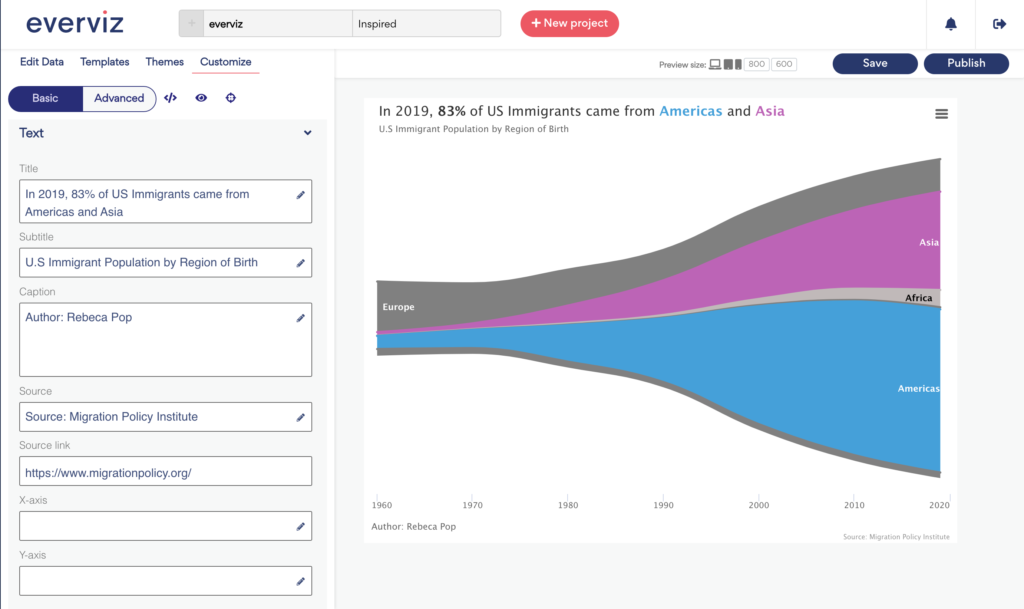
This panel will also open by default when opening the everviz editor.
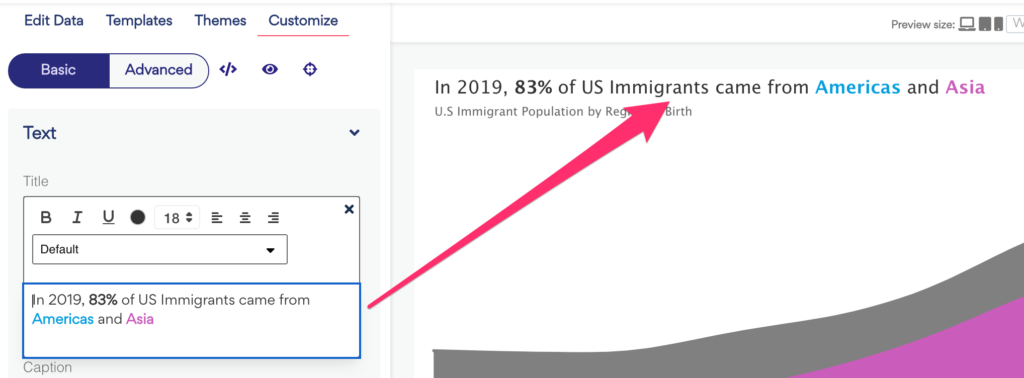
Another nice feature worth mentioning is that all fields supports rich text editing if you click on the little pen icon next to the field.
This opens a small WYSIWIG editor where you can customize textual content and design options without any coding:
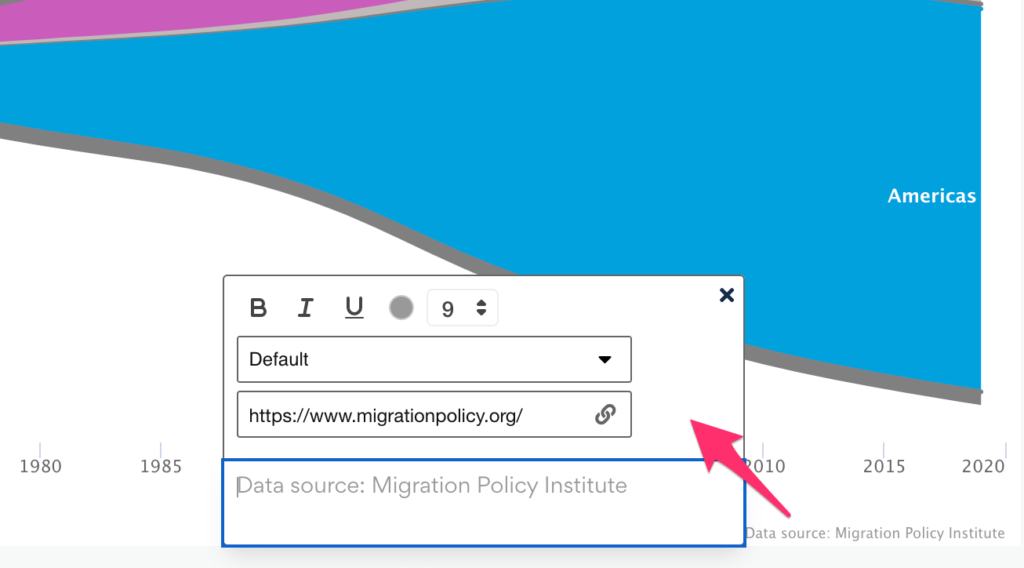
You can also change the text and styling of any of the fields by clicking on the field in the preview panel. The below screenshot shows an example where we have clicked in the source field in the preview. This opens an inline rich text editor where you can fill in text and change the styling options.
To learn more about working with text, check out the knowledge base