We’re excited to share with you a new feature in beta: Download project as video
Our mission is to make it easy for anyone to create and publish stunning visualizations to tell compelling stories.
everviz makes the chart generation process as simple as possible, and allows you to enrich your content on different platforms to save time and money.
Create the visualization once, and distribute to your website, print material, presentations or Social Media
With the new video download feature you can now repurpose your charts in videos as well. Bring your data to life with animated graphs and retire your Adobe After Effects or Apple Motion graphics templates.
Here is a quick video how the end result could look like:
How it works
The process is very simple:
- Import your data and pick chart, graph or map template
- Customize design and animation
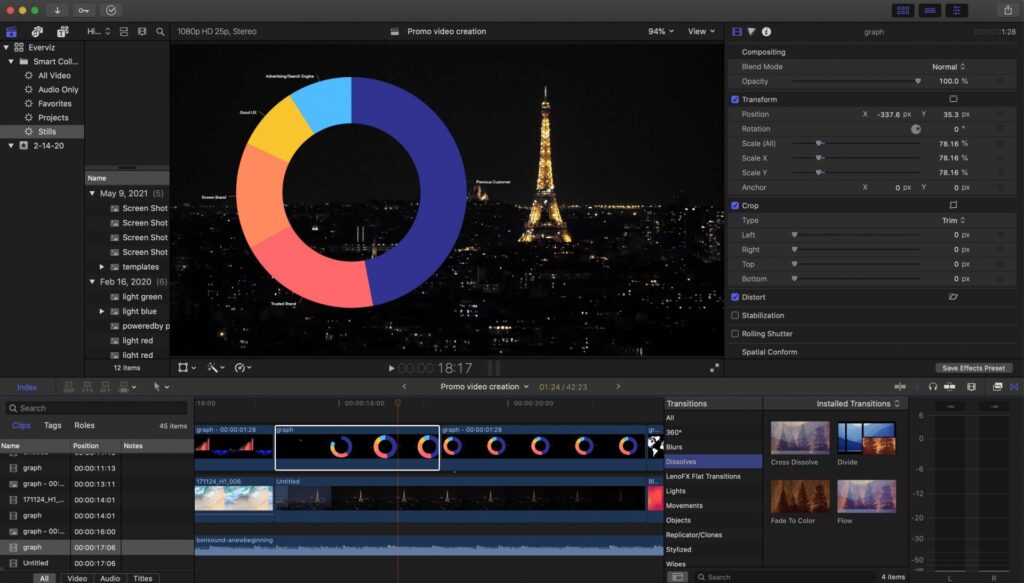
- Download your project as an high quality transparent video file and add it to your favorite video editing tool
The following screenshot shows how the video can be added in Final Cut Pro, but you could use Adobe Premiere, iMovie or any other video editing tool of your choice.
For more information about the usage, please see this help article.
Ready to try?
Are you interested in trying the video download feature in beta? Get in touch through the form below. No strings attached, and completely free during the beta period.