📺everviz charts can now be seamlessly inserted into live video – making multiplatform data visualizations possible.
Until now, making charts for live video required specialist design resources. With everviz, journalists and any newsroom staff can create a chart and publish it to air in just a few clicks.
This is made possible through our integration with HTML graphics tool Viz Flowics.
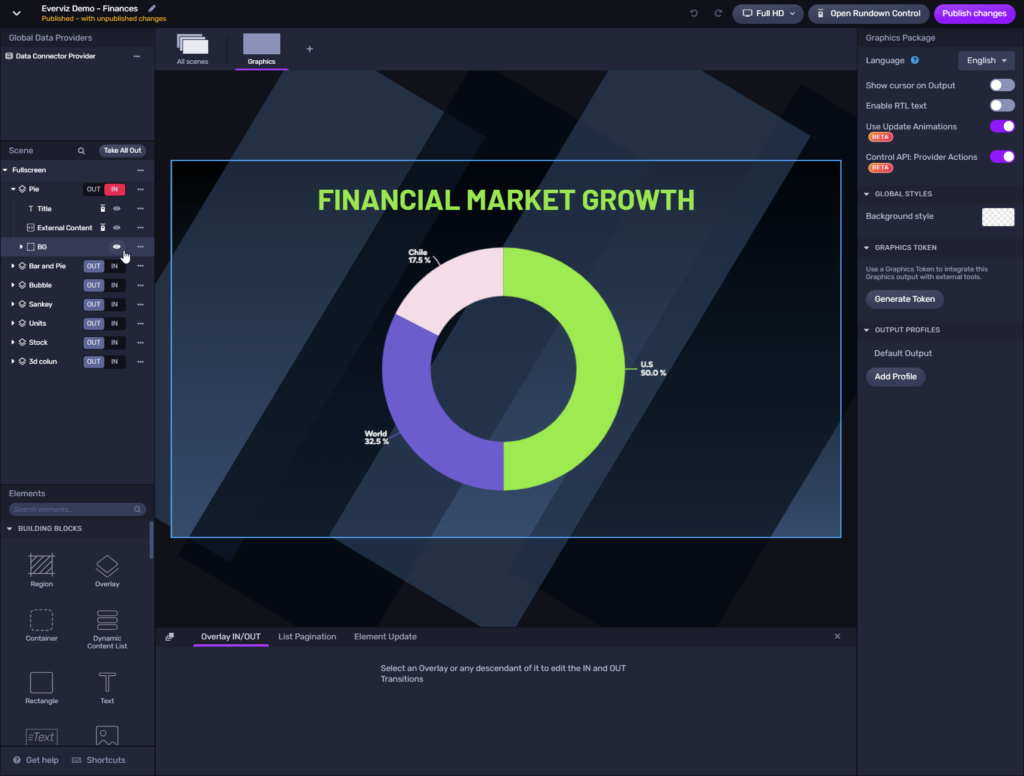
An everviz donut chart illustrating financial information in a Viz Flowics broadcast graphic template.
Adding charts to live video means broadcasters and digital publishers can now easily enrich their coverage of elections or sporting events with beautiful and engaging data visualizations.
Curious about the integration with Viz Flowics? Visit their website here or get in touch with us by emailing [email protected].
Introducing multiplatform publishing
The live video export option is one of many new export options now supported by everviz.
A big part of a company’s digital first strategy is surfacing their content on all platforms. Audiences are dispersed over the internet, consuming information on forums, video upload sites, social media, news sites and a company’s own website, plus offline formats such as newspapers and magazines.
We want to make it easy to publish your content to all platforms where you meet your audience.
So today we are launching multiplatform publishing. In a nutshell, this gives you the ability to create beautiful visualizations in one place and publish to many platforms.
Export options added to publishing panel
The publishing panel has been completely revamped to make it easier to export charts in different formats.

What can you export?
everviz now supports exporting a visualization for publishing on the following platforms:
- Online for embedding a chart on your page
- Social for embedding in a post on Facebook, Instagram, LinkedIn or Twitter/X
- PDF/print for print formats
- Code (HTML/JSON) for self hosting
- Live video for TV news and digital publishers
- Video for overlaying the chart animation onto another video
Exporting a chart as a video captures the chart animation. The chart animation loads when the chart loads on a page. You can slow it down or speed it up. More details on our help page.
Visit our knowledge base to learn the ins and outs of publishing and exporting charts in different formats.
Note: Access to export options is determined by your subscription plan. Email us [email protected] to inquire about upgrading. Visit our pricing page to learn more about the export options available to you.
Wondering anything else? Get in touch with us by completing the form below.💭


