We have been busy adding features to everviz that will help you become even more productive with visualizations.
Follow us on Twitter or Facebook to get the updates as soon as they get released!
Here’s a quick rundown of the latest changes:
Animate on view ????
Previously, the animation happened when the page was loaded. If the visualization was off-screen whilst the page was loaded, the reader could not see the animation effect.
This is now fixed, and the animation is now triggered when the visualization is in view.
Animate on view works out of the box on both inject and IFrame codes for newly published projects.
Animation speed
In relation to the above, we have also made it possible to control the speed of the animation.
In the basic editor, open Animation, and set the animation duration using the slider. Click the play button to preview.
Second axis
Adding a second y-axis can now be done in the Basic editor.
Choose Axes and tick “Use Second Axis” under Vertical Axis.
Labels
You can now customize your Data Labels from the basic editor.
To customize the appearance of the Data Labels, choose Data Labels in the basic editor.
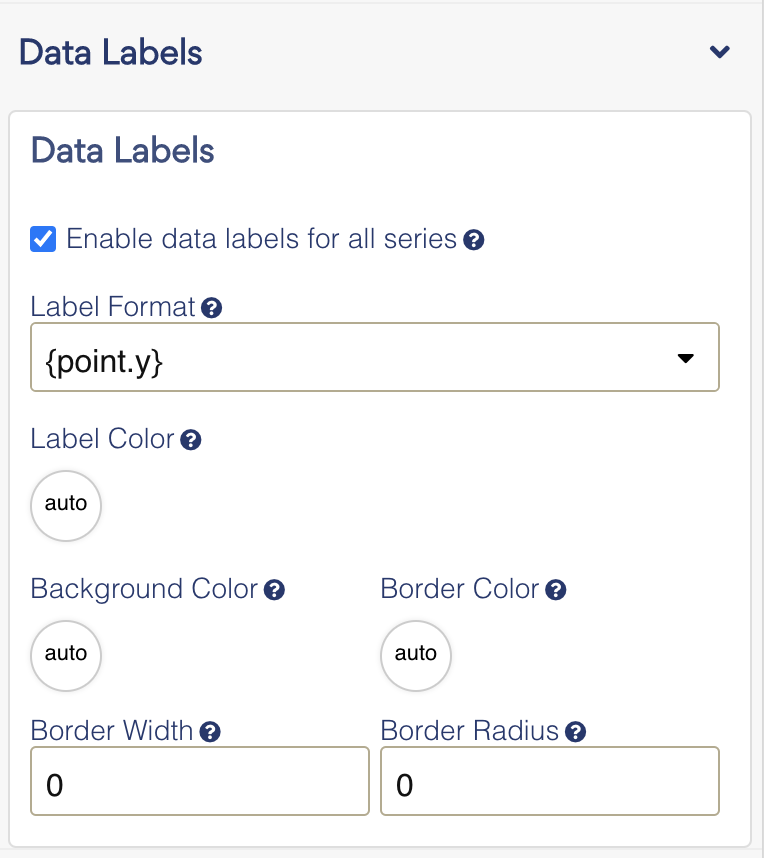
Table rich text editing
The Table editor now supports Rich Text editing. Align text, add hyperlinks and change text style using this intuitive interface.

Localization
It is now easier to change localization options such as language, number and date formats.
You can find the localization options in the editor. See this gif and result below.