Introduction
In this post, we’ll show you how to use the GOOGLEFINANCE function with everviz to create interactive charts and visualizations, and make the most of live Google Finance Data.
Before we dive into the examples, have a look at this chart to understand what you’ll be able to achieve.
Note: To access all the data and formulas in this document, simply open the Google Spreadsheet. You can create a personal copy by selecting “File” and then “Make a copy”.
What is the GOOGLEFINANCE Function in Google Sheets?
The GOOGLEFINANCE function in Google Sheets is a built-in function that allows users to access a wide range of financial data and information directly within their spreadsheets.
This function provides real-time and historical data on various financial instruments, such as stocks, bonds, currencies, and market indices. Users can utilize GOOGLEFINANCE to retrieve data like current stock prices, historical stock price trends, company market capitalization, dividend yields, trading volumes, and much more.
The function is particularly useful for individuals, investors, and financial professionals who want to monitor and analyze financial data without needing to leave their Google Sheets document. It can be used to track investments, create financial dashboards, analyze market trends, and generate reports with up-to-date financial information.
Here’s a basic example of how to use the GOOGLEFINANCE function to fetch the current price of a stock:
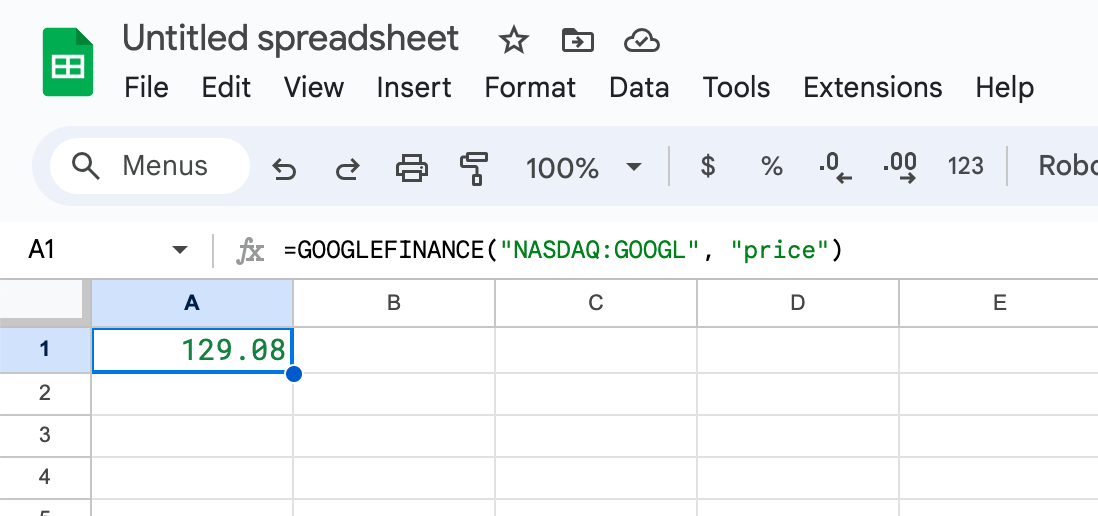
=GOOGLEFINANCE("NASDAQ:GOOGL", "price")In this example, the function retrieves the current stock price for Google (Alphabet Inc.) listed on the NASDAQ stock exchange.
The GOOGLEFINANCE function is versatile and can be used for a wide array of financial data needs, making it a valuable tool for anyone working with financial information in Google Sheets.
How to use the GOOGLEFINANCE Function
The GOOGLEFINANCE function in Google Sheets has a specific syntax that you need to follow to retrieve financial data. The basic syntax of the GOOGLEFINANCE function is as follows:
=GOOGLEFINANCE(ticker, [attribute], [start_date], [end_date], [interval])For additional details regarding the syntax, you can refer to Google’s help documentation. Keep in mind that not all attributes are applicable to all financial instruments, and not all stock exchanges or markets are supported by GOOGLEFINANCE. You may need to check Google’s documentation or experiment to see which attributes are available for a specific financial instrument.
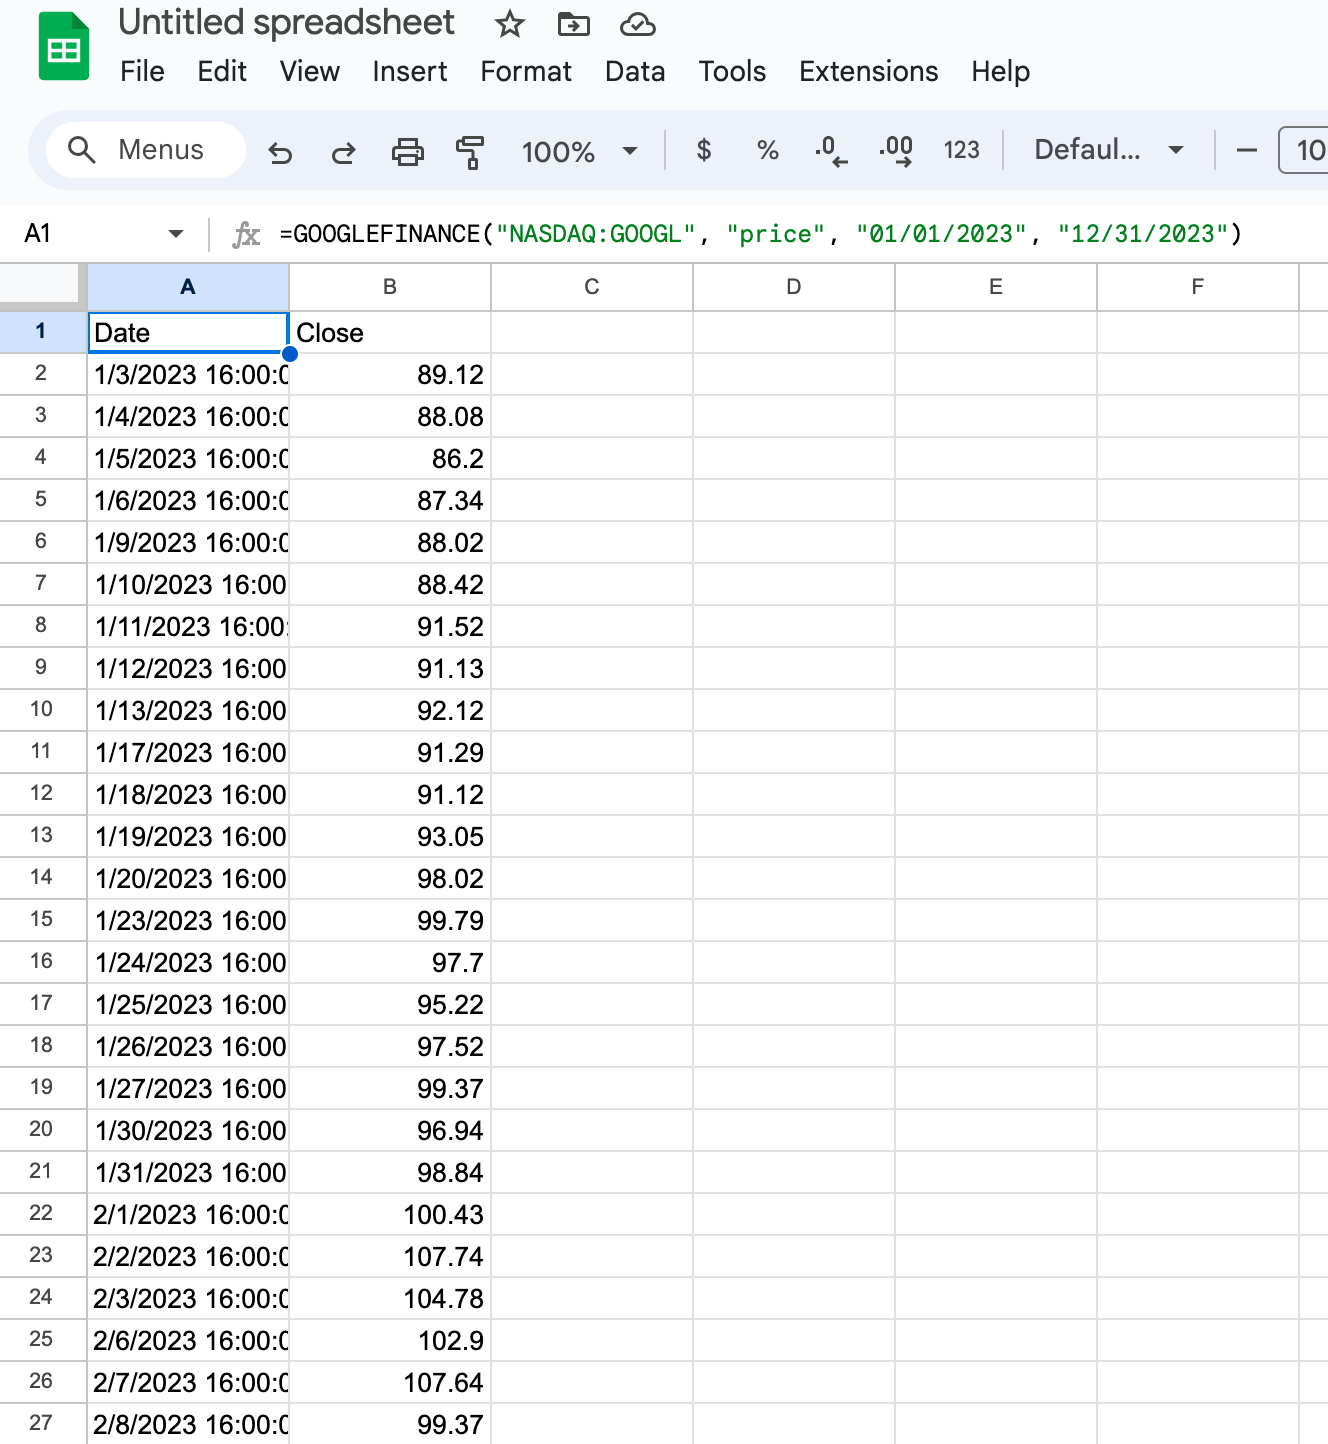
Here’s an example of the GOOGLEFINANCE function:
=GOOGLEFINANCE("NASDAQ:GOOGL", "price", "01/01/2023", "12/31/2023")This function fetches the daily closing prices for Google’s stock (GOOGL) on the NASDAQ stock exchange for the whole year 2023.
Visualize the data
With data now at our disposal, we’re prepared to employ everviz for visualization. Initially, we’ll begin with a basic sample, followed by more comprehensive examples later in this document.
After following the steps, your outcome should resemble something like this.
Prerequisites
Important! In order for everviz to read the data, you need to publish the spreadsheet and make it visible for anyone. See more information in our knowledge base
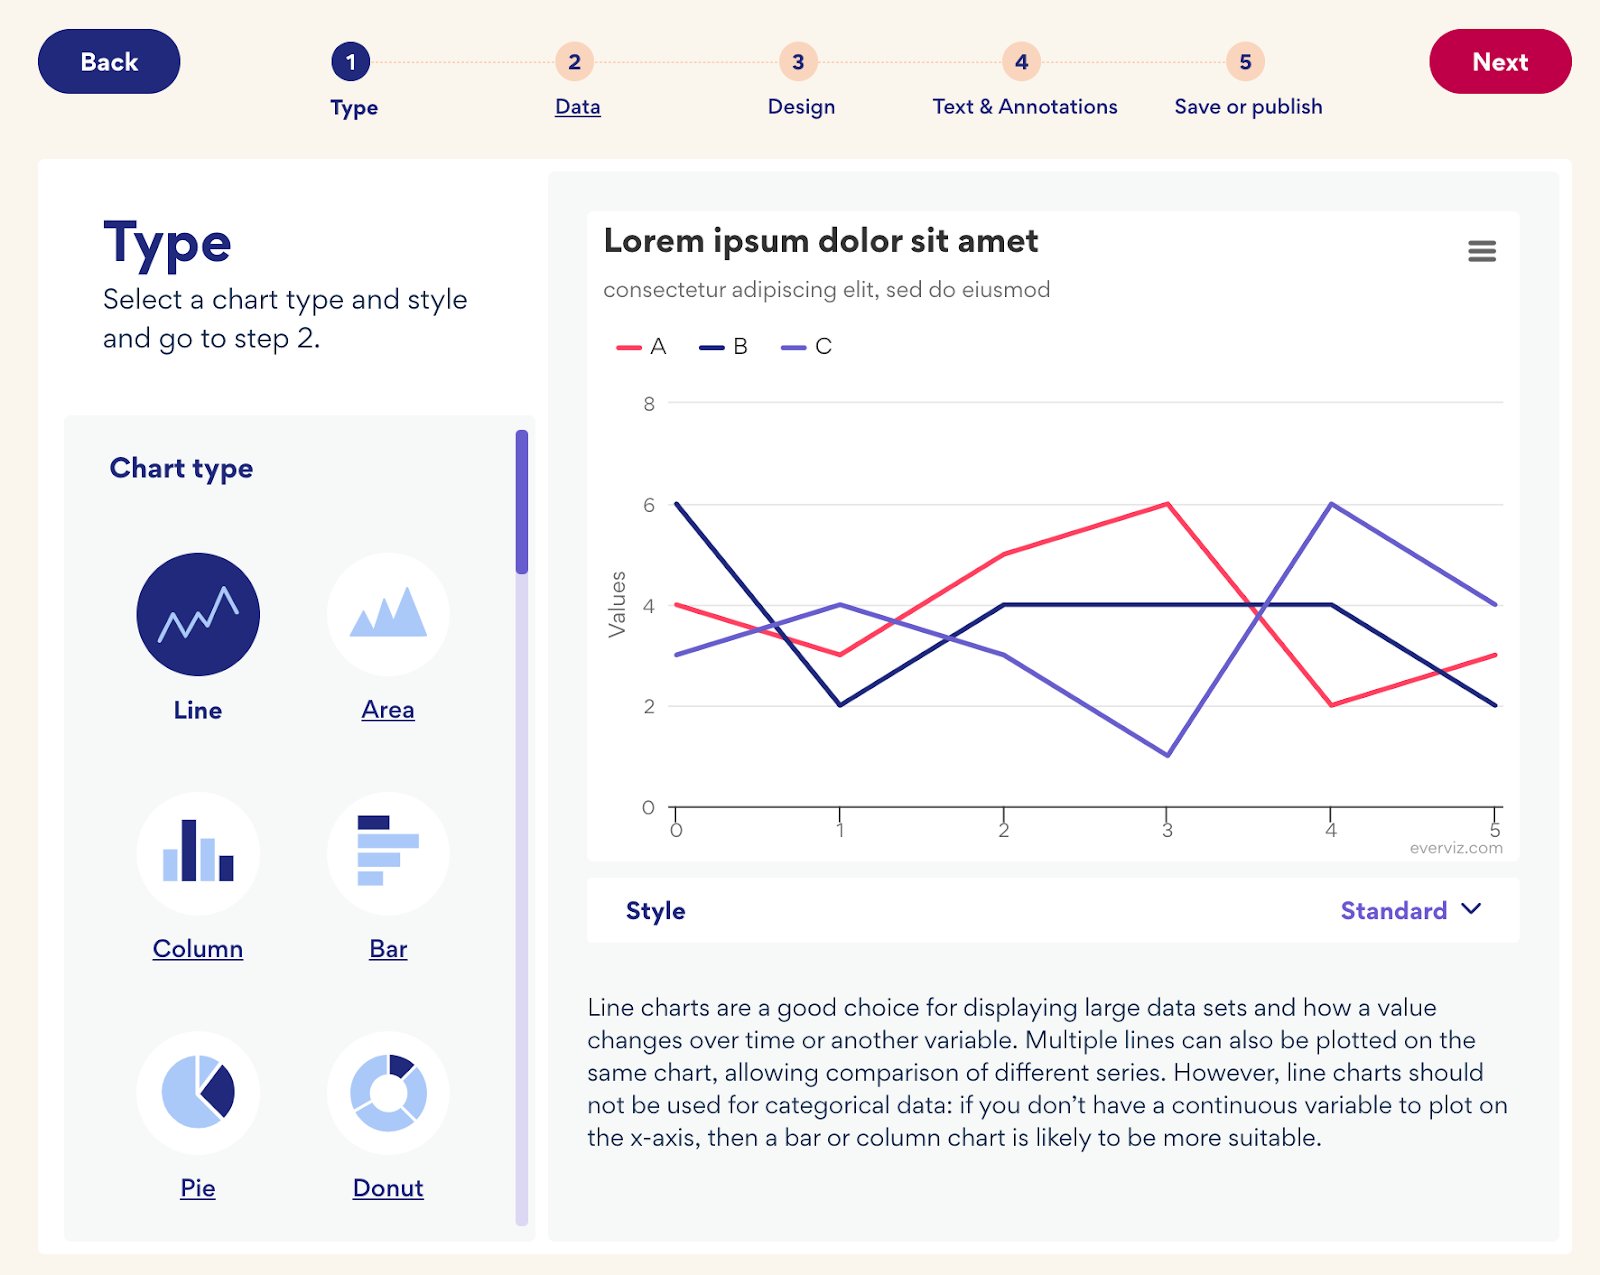
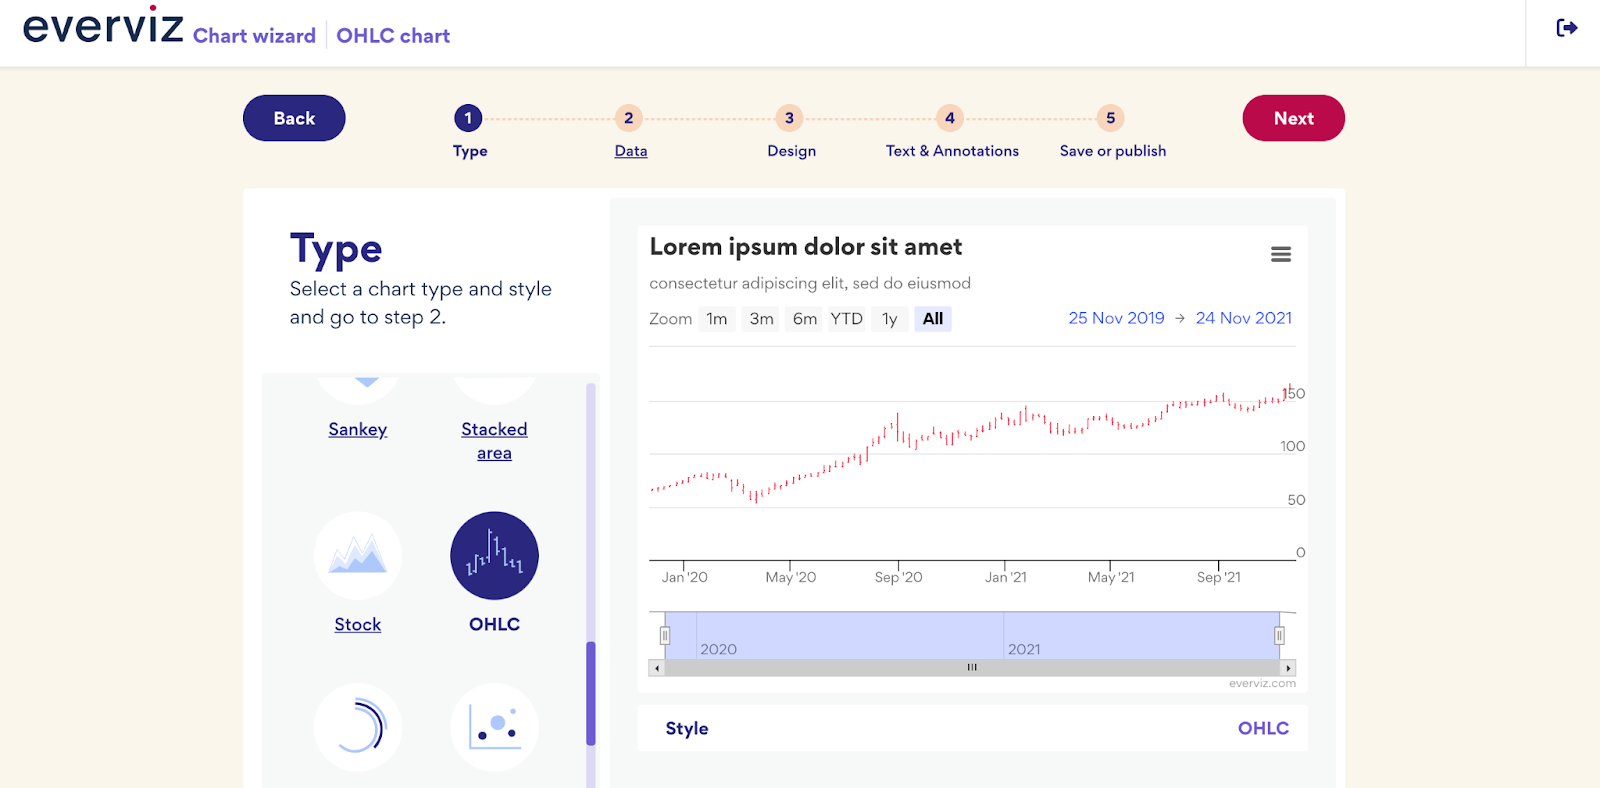
Step 1: Create chart
- Open everviz at https://app.everviz.com
- Click create a new project and choose Chart
- Choose Line as chart type
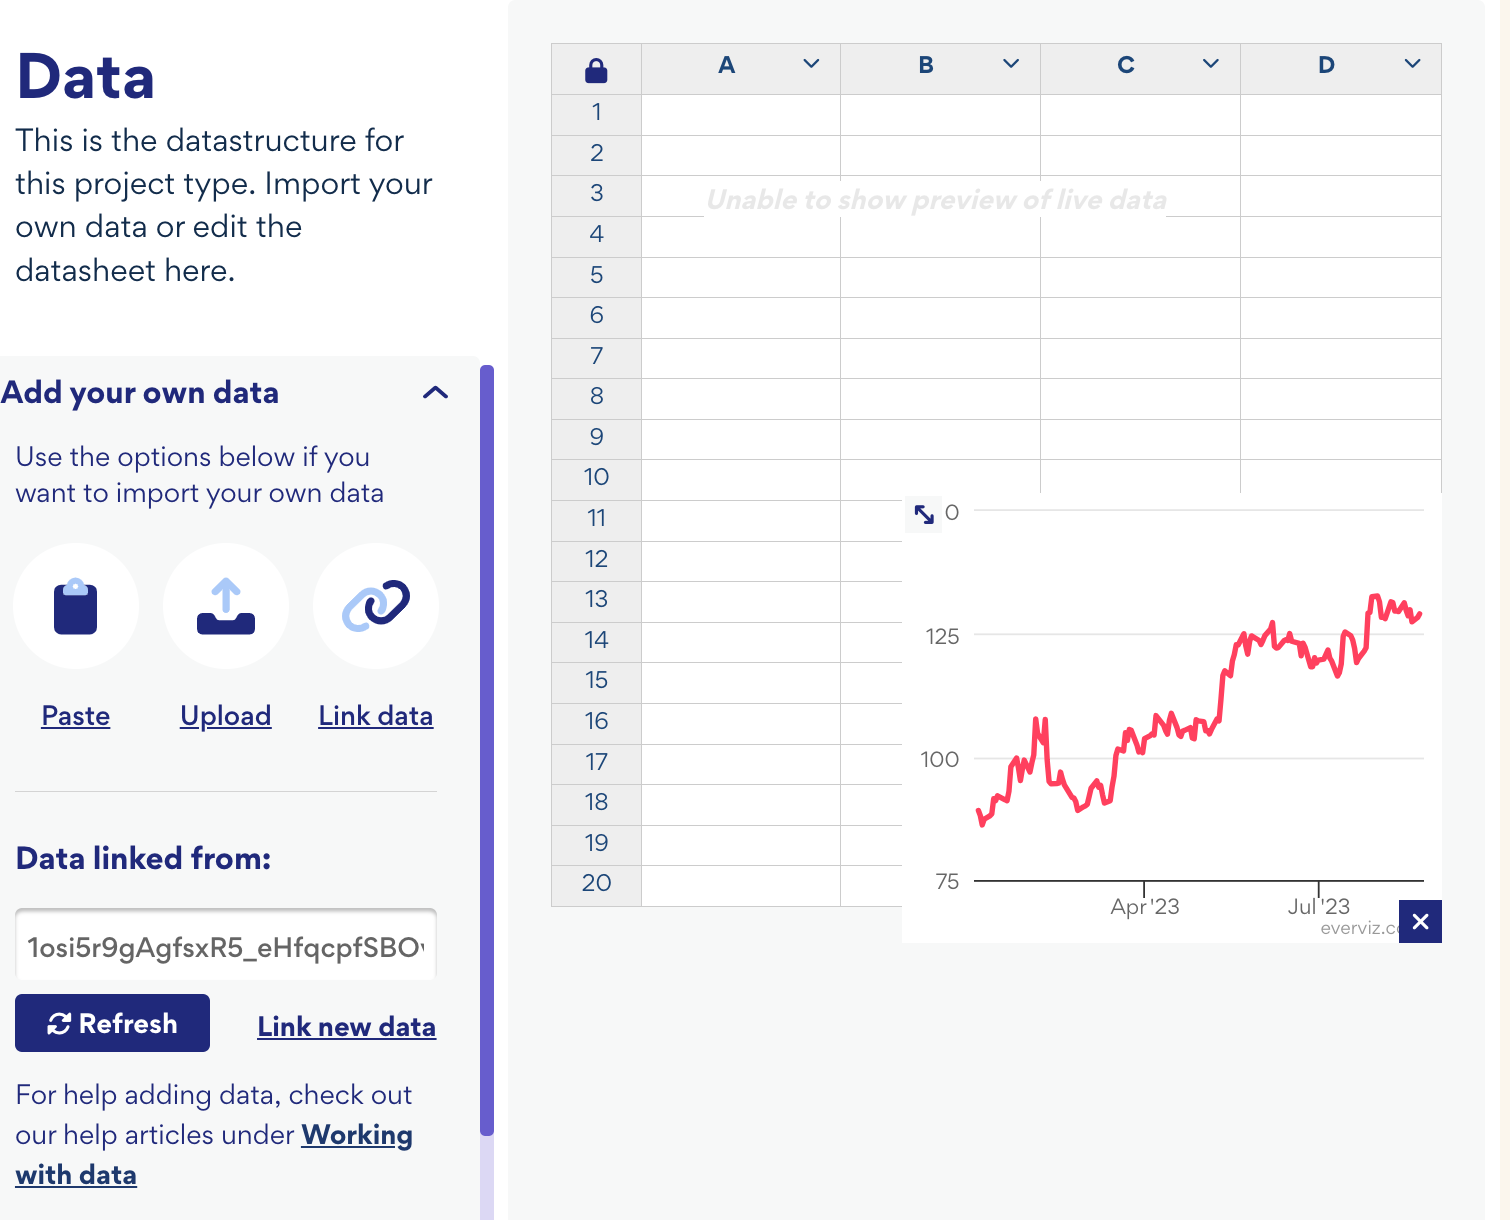
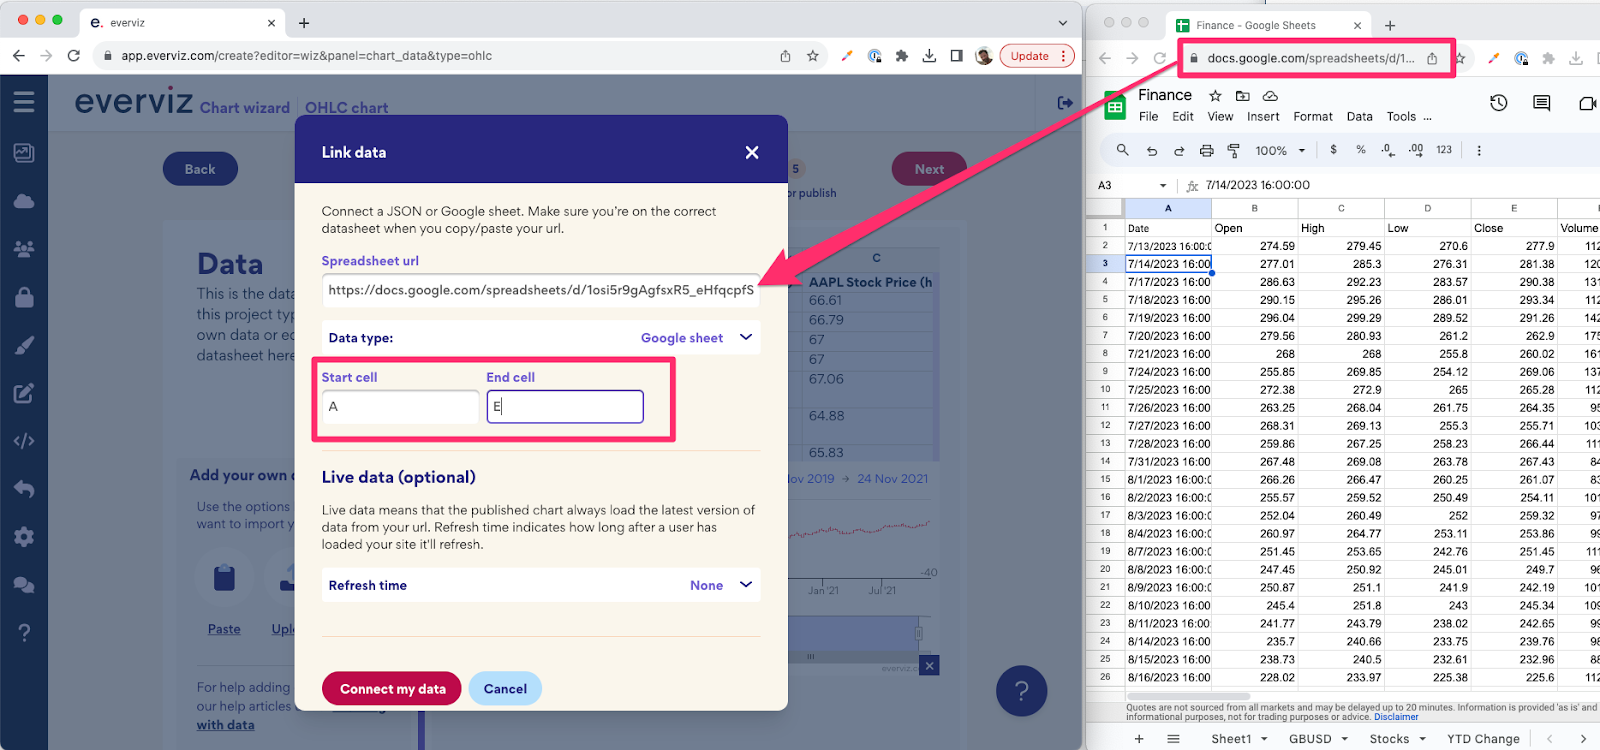
Step 2: Link data
- Click Link data
- In the Spreadsheet URL field, paste the URL from your Google Sheet:


You will now see a preview of your Google Sheets data in everviz
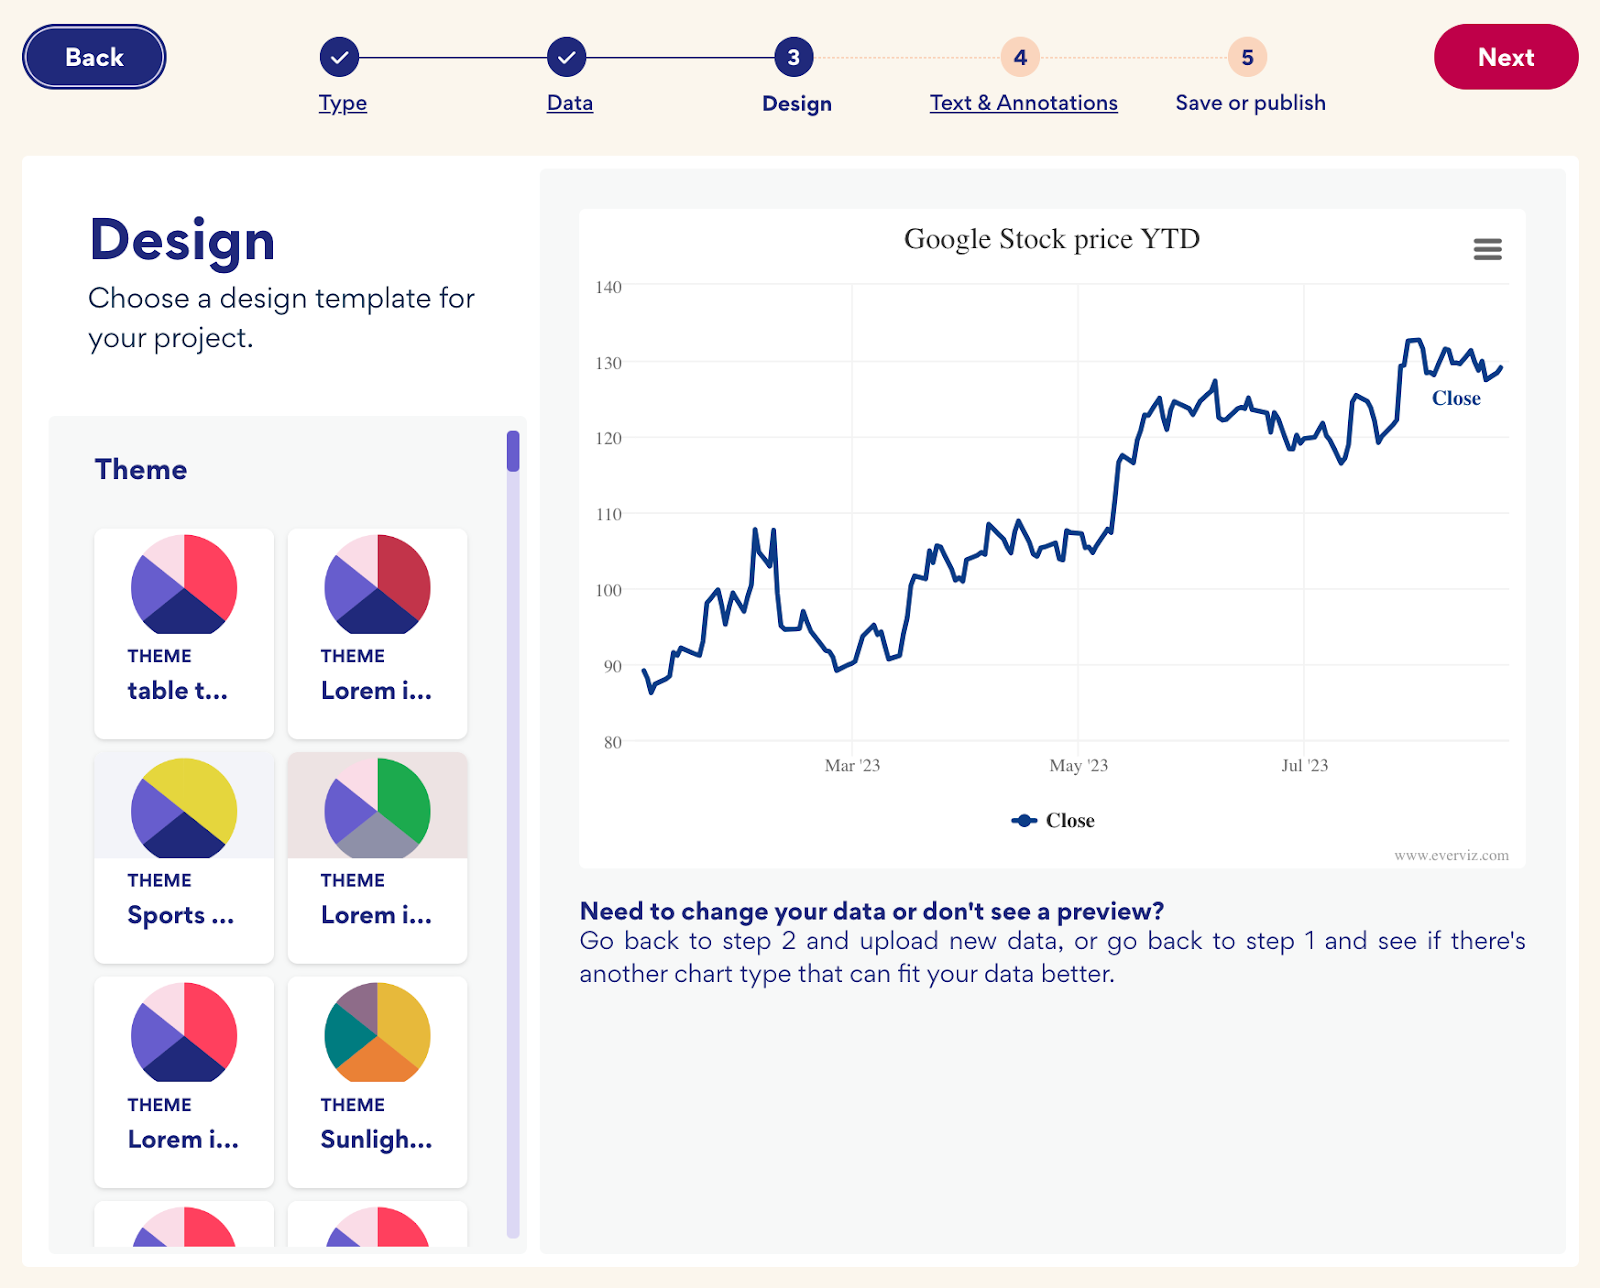
Step 3: Design
Pick your custom branding for your project
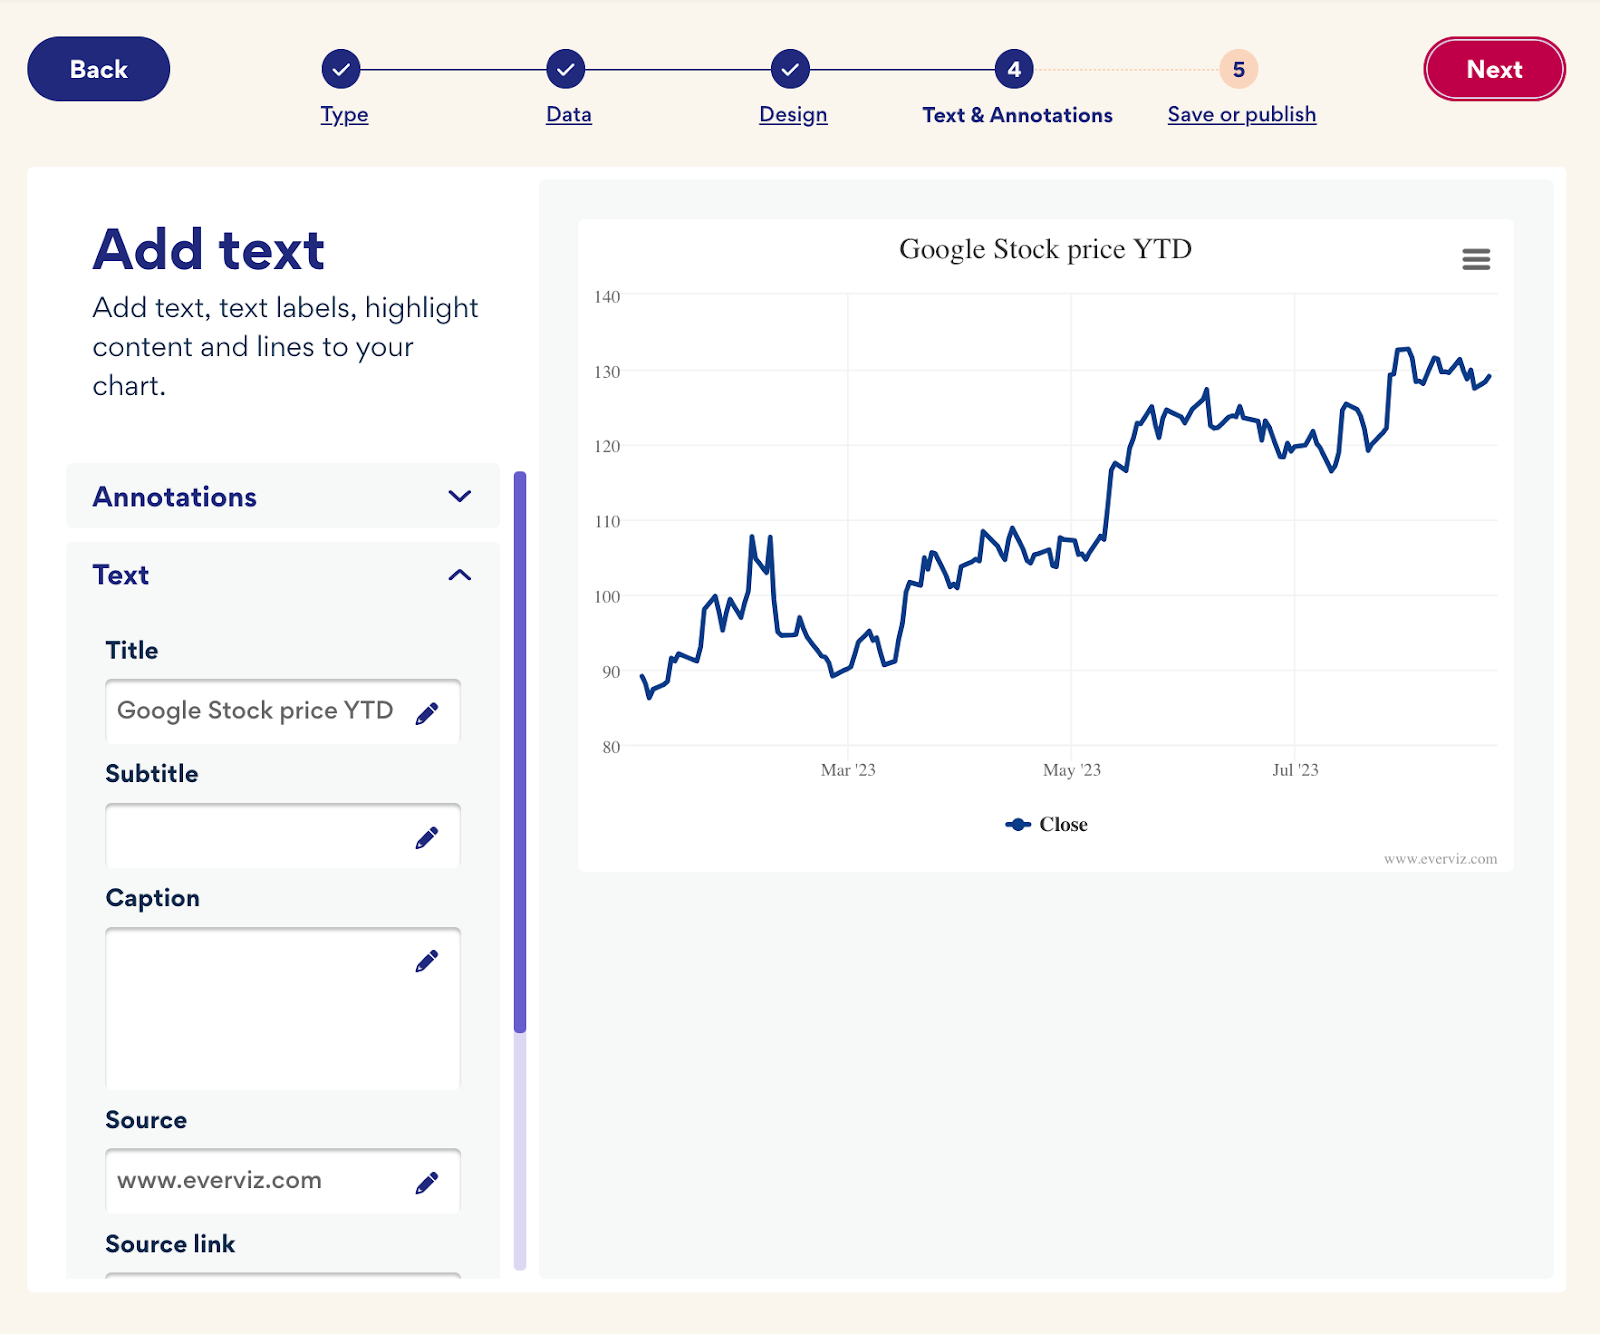
Step 4: Text & Annotations
Add text to make the chart easier to read
Step 5: Save or publish
Save and publish to any platform where you meet your audience.
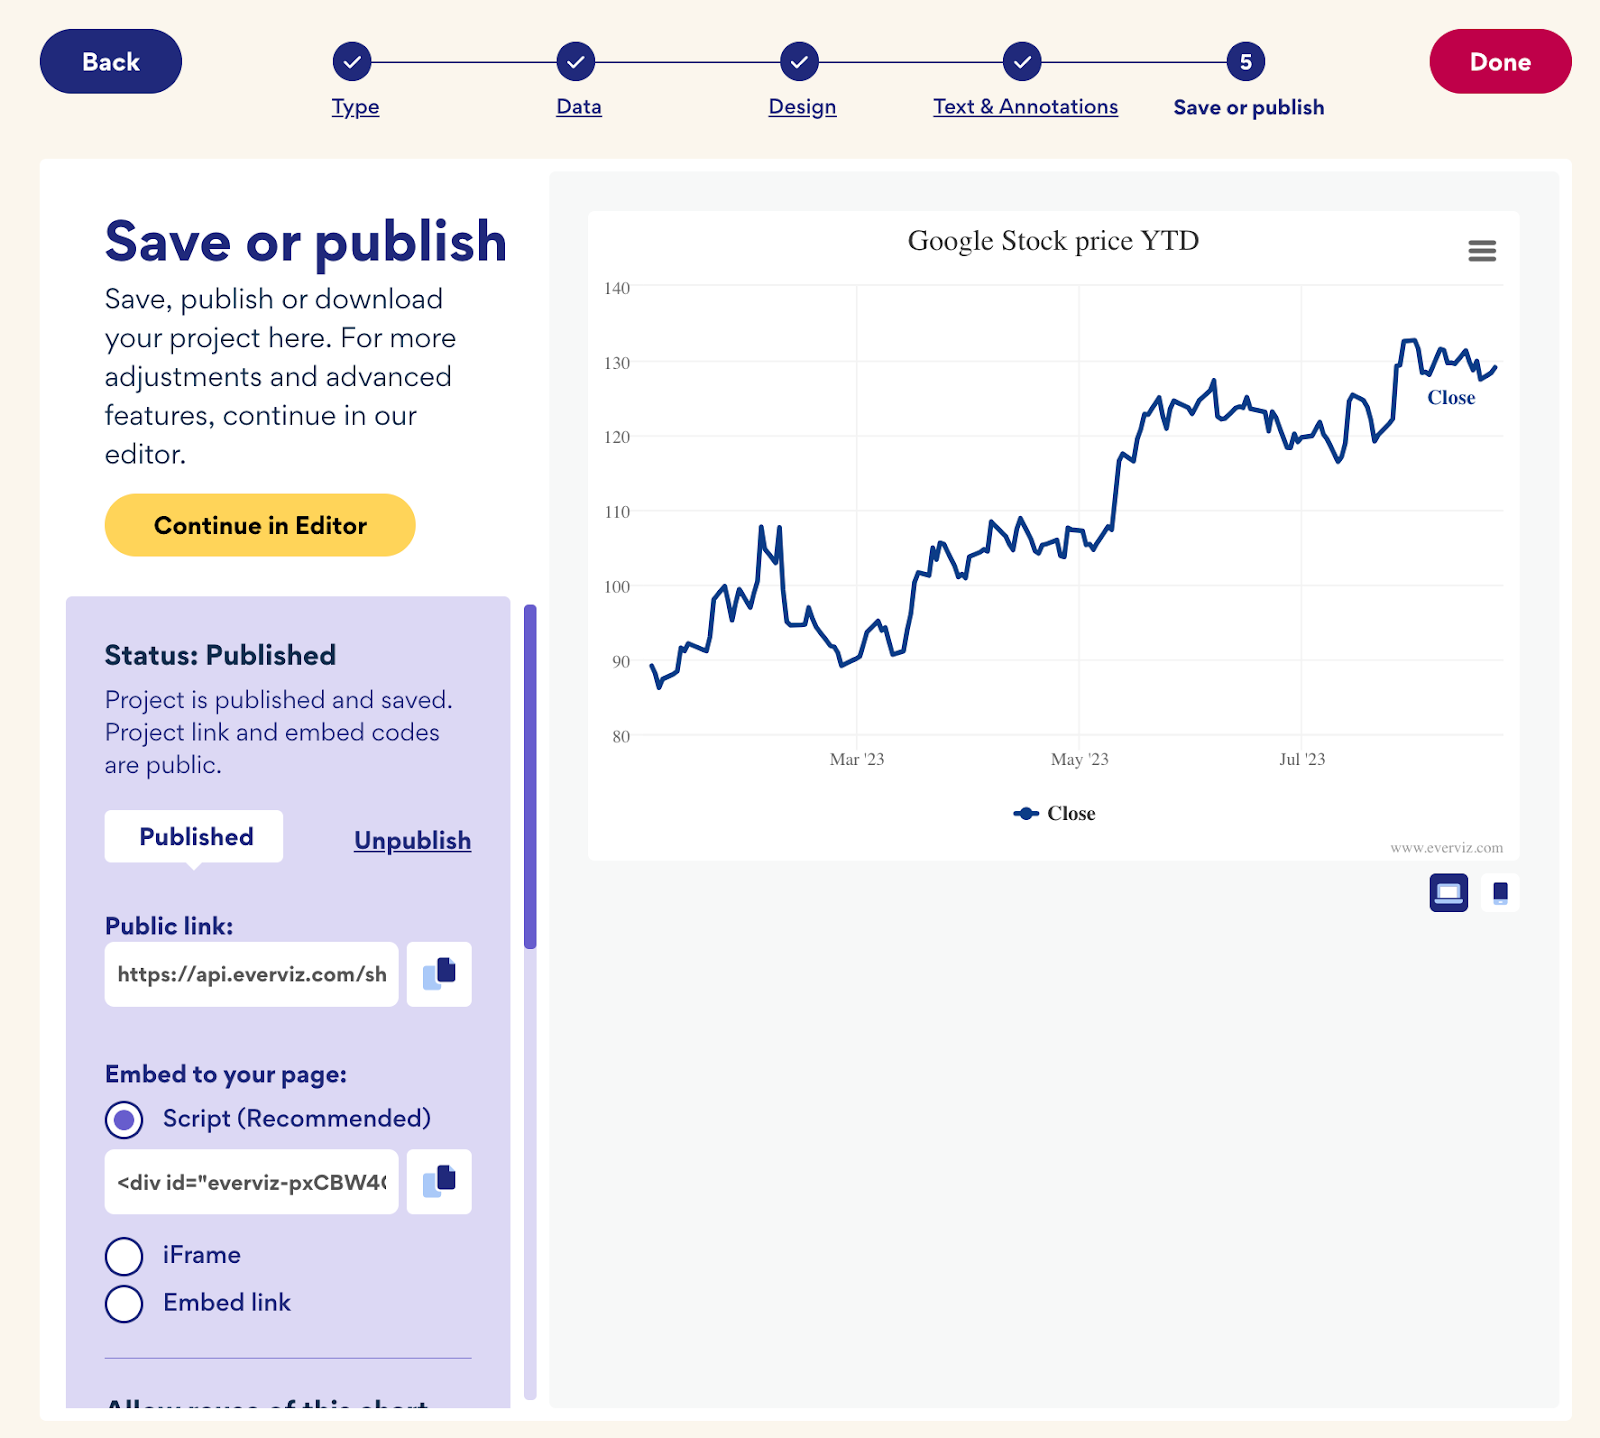
For more customization, click on Continue in Editor
Currency conversion
Have you ever used Google to look up currency exchange rates or requested Google to convert one currency into another?
When you search for queries like “1 GBP in USD” the results typically display information like this:
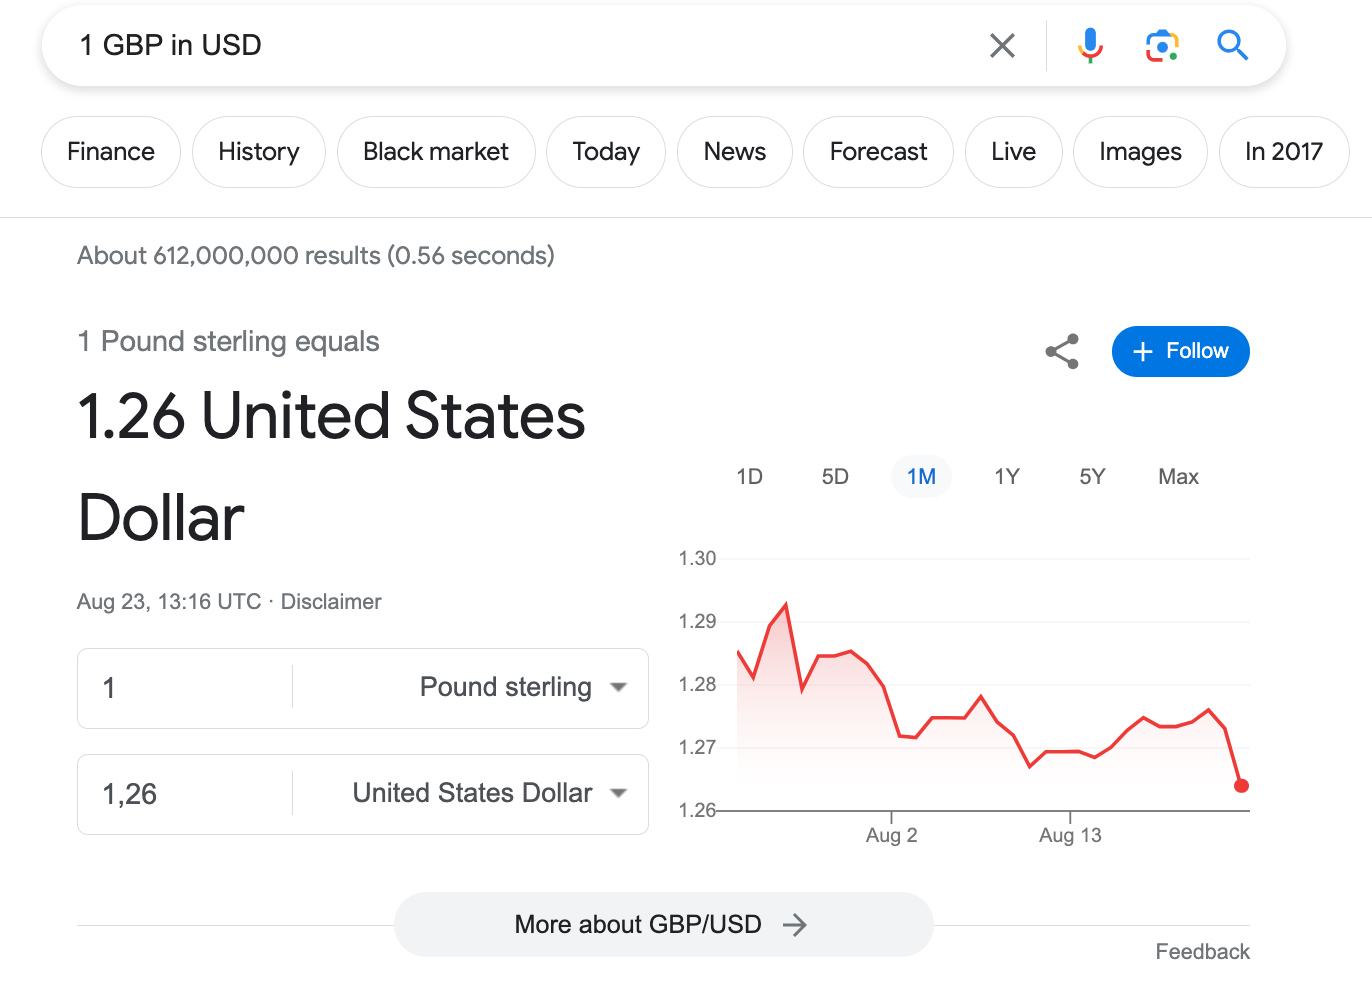
You can do the same thing using the GOOGLEFINANCE function and visualize the results with everviz
Using GOOGLEFINANCE for currency conversion
We took our existing spreadsheet and added another tab.
To perform currency conversion using the GOOGLEFINANCE function, you can follow these steps:
In an empty cell of your spreadsheet, input the GOOGLEFINANCE function with the appropriate parameters. The fundamental syntax for currency conversion is as follows:
=GOOGLEFINANCE("CURRENCY:source_currencytarget_currency")Replace source_currency with the currency you intend to convert from and target_currency with the currency you want to convert to. For instance, to convert British Pounds (GBP) to US Dollars (USD), you would use:
=GOOGLEFINANCE("CURRENCY:GBPUSD")Press Enter, and the cell will display the current exchange rate for the specified currency pair. This rate signifies how many units of the target currency you receive for one unit of the source currency.
If you wish to visualize the currency exchange rates over a specific period, you can include parameters for dates. The syntax would appear as follows:
=GOOGLEFINANCE("Currency:GBPUSD","price",TODAY()-50,TODAY())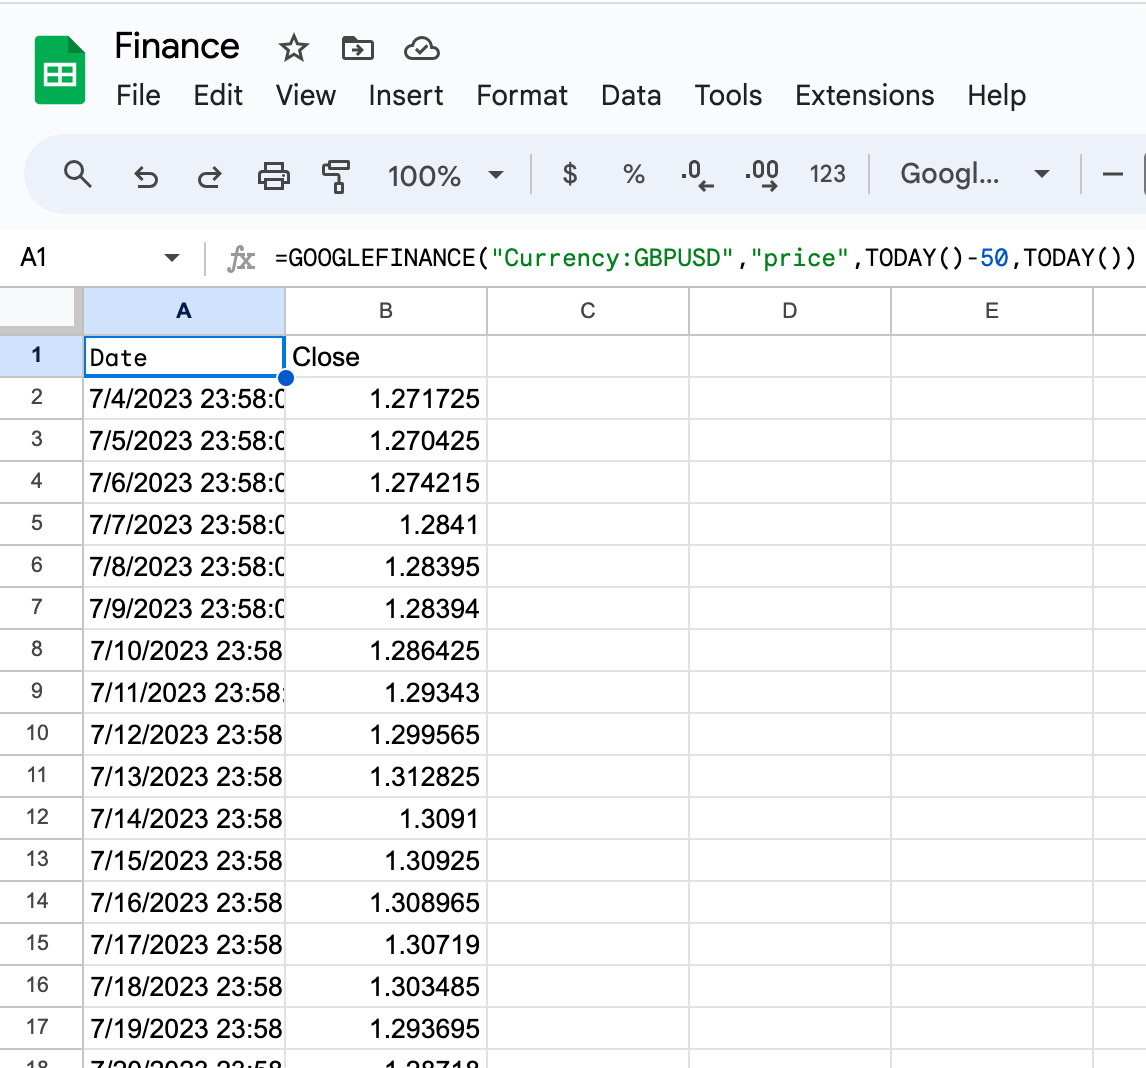
In this example, we are retrieving rates for the last 50 days.
This approach allows you to track currency exchange rates over time and gain insights into their historical trends.
Given your familiarity with linking this data to your everviz charts, you’re well-equipped to create visually-appealing currency charts.
Here’s an example:
Stock performance comparison
The next phase in our tutorial on utilizing GOOGLEFINANCE functions involves comparing various stocks. This exercise builds upon our previous examples, taking it a step further by including multiple stocks.
Let’s take a look at Apple and Alphabet and see how they have compared with the S&P 500 Index this year.
The result will look like this:
Let’s go back to the Google Sheet. Here we have added a new sheet (Stocks) and inserted three different formulas.
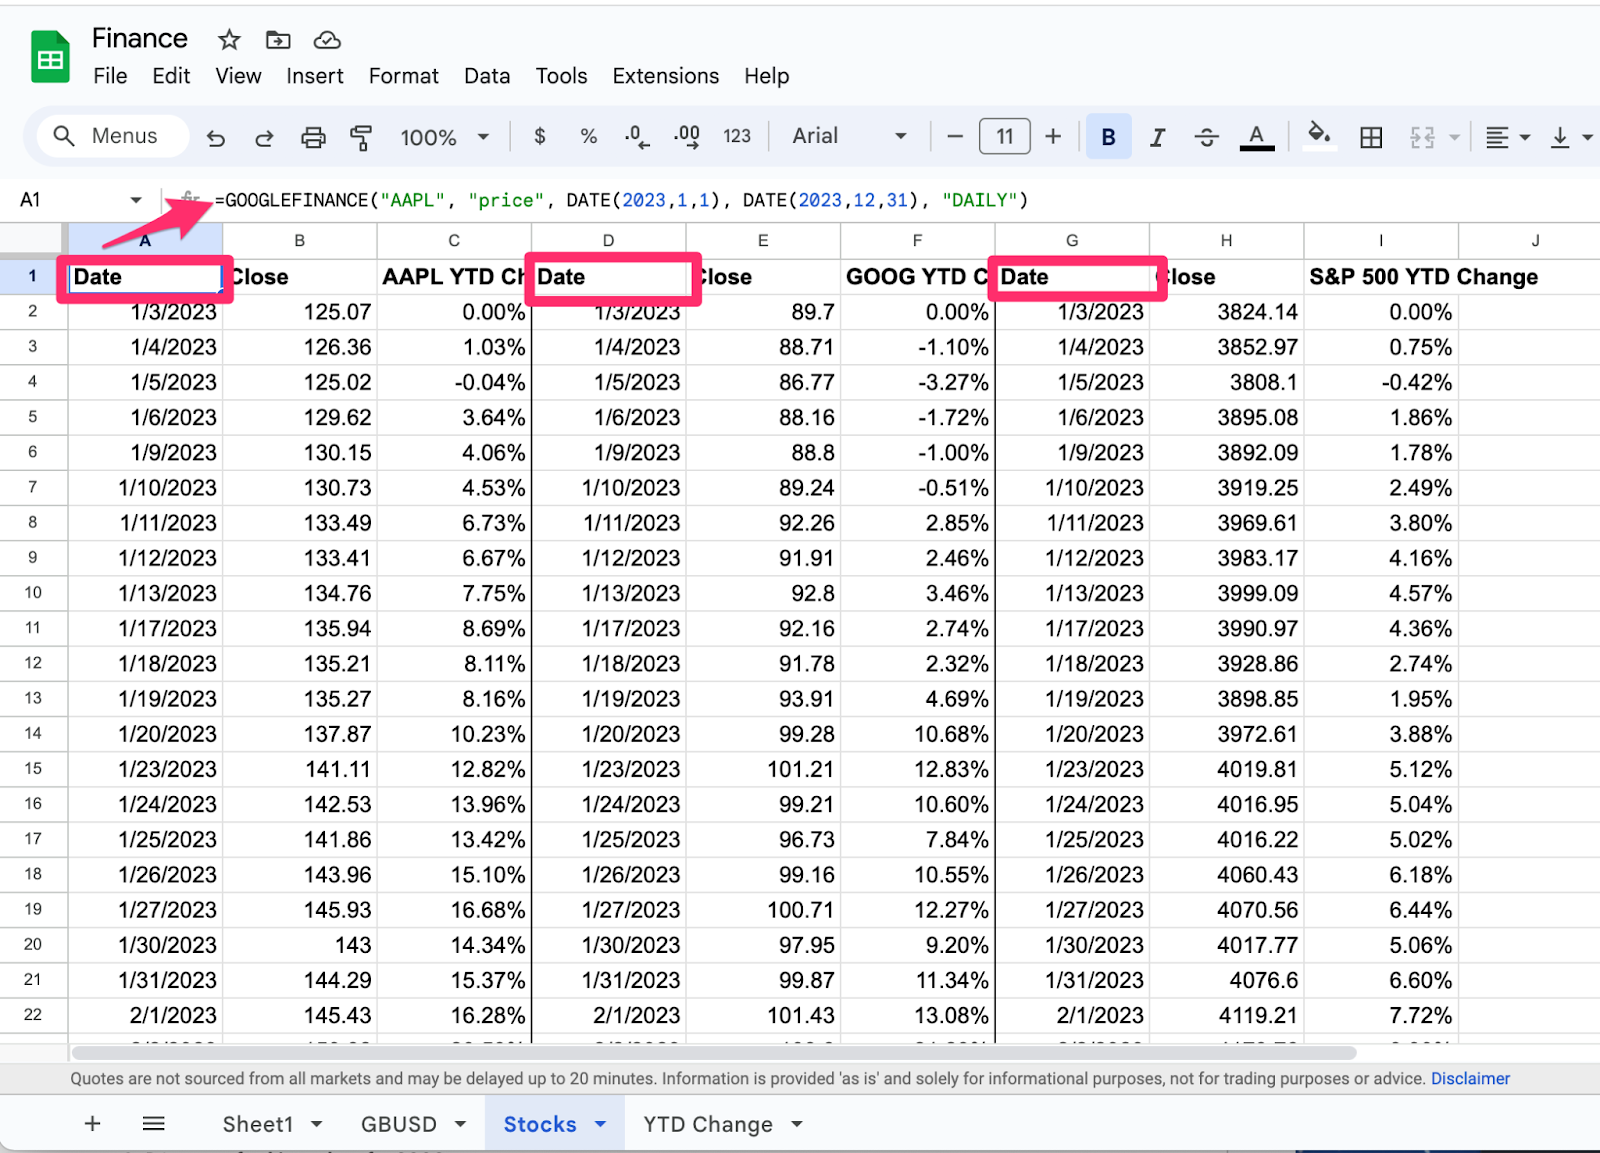
In A1: we have added formula to fetch YTD values for AAPL
=GOOGLEFINANCE("AAPL", "price", DATE(2023,1,1), DATE(2023,12,31), "DAILY")In D1, we are fetching values for GOOG
=GOOGLEFINANCE("GOOG", "price", DATE(2023,1,1), DATE(2023,12,31), "DAILY")In G1, we are fetching values for S&P 500
=GOOGLEFINANCE("INDEXSP:.INX", "price", DATE(2023,1,1), DATE(2023,12,31), "DAILY")With all the data in hand, there’s one final step to be taken within Google Sheets to organize and prepare it for visualization.
For our visualization, we’ll solely require the dates and percentage changes. There might be various methods to achieve this but in this instance, we’ve opted to create an additional sheet within the spreadsheet and query the necessary columns from the Stocks sheet.
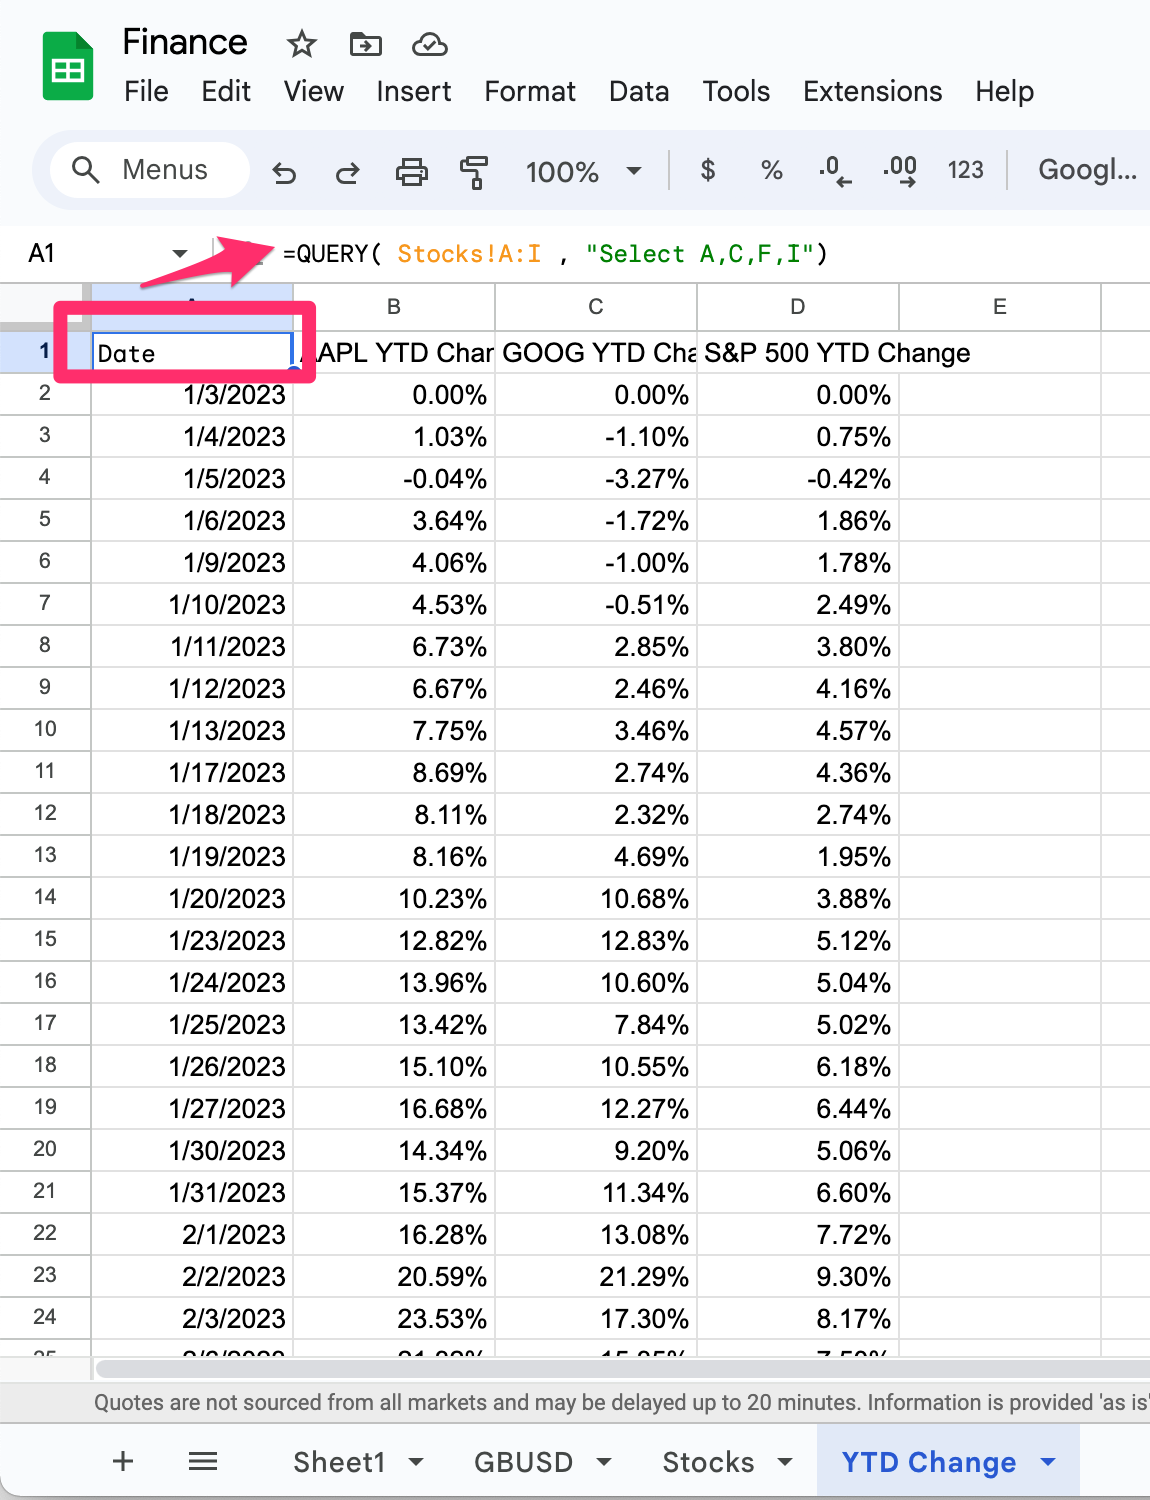
Now that the data has been organized and prepared, it’s ready for integration into everviz. Simply establish a connection with the new sheet and craft an interactive chart.
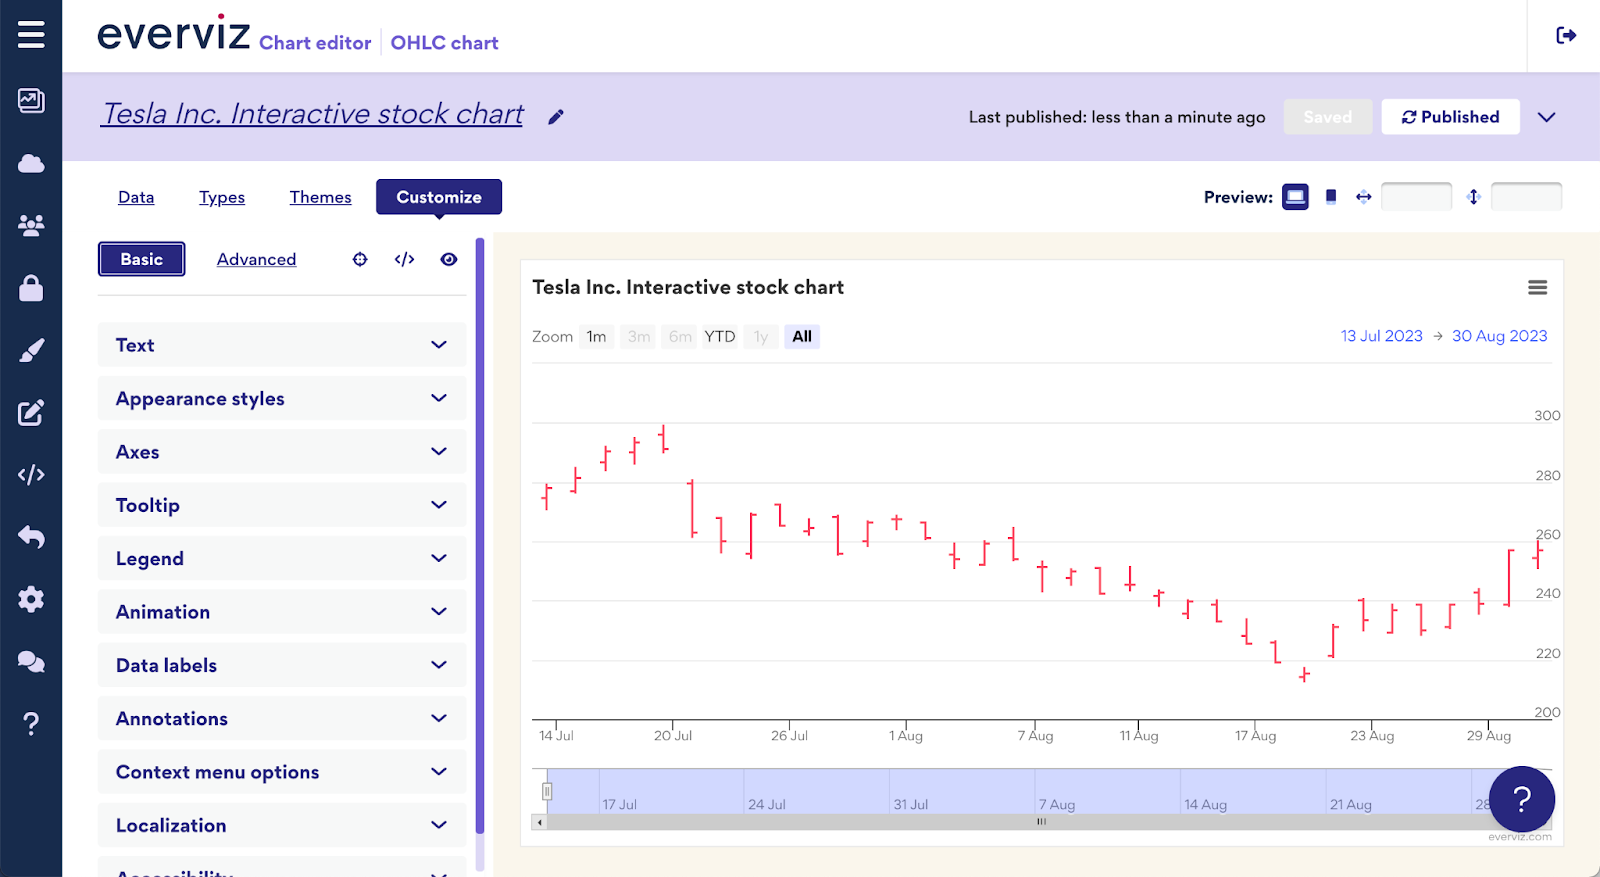
Mastering Open High Low Close (OHLC) charts with Google Finance
In this chapter, we will explore the world of OHLC (Open, High, Low, Close) charts, which are fundamental for tracking stocks and commodities. You will discover how to effectively create and customize OHLC charts in everviz, allowing you to present Google Finance data in a compelling manner.
As you read this chapter, you can effortlessly create a chart that looks like this:
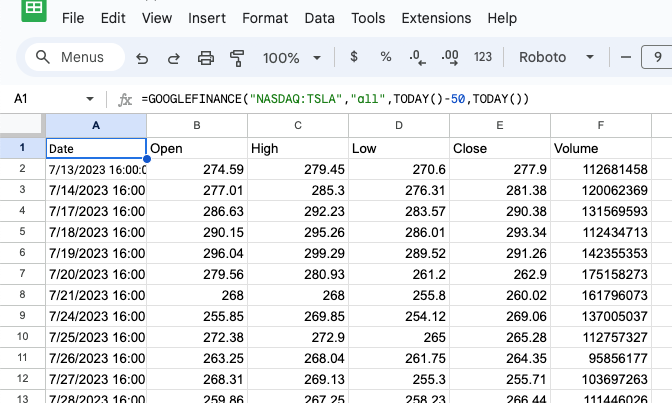
But before we proceed to create the OHLC chart in everviz, let’s revisit your Google Sheet. Our first step is to retrieve OHLC data for Tesla stock using the Google Finance API.
We have created a new sheet and inserted the following formula into the first cell:
=GOOGLEFINANCE("NASDAQ:TSLA","all",TODAY()-50,TODAY())By utilizing the “All” attribute, we specify to Google that we want to retrieve Open, High, Low, Close, and volume data. Using the start date and end date parameters we have requested data for past 50 days. You can easily adjust the time range according to your preferences. When applying the formula we get the following result in Google Sheet:
Now, let’s move over to everviz. Begin by creating a new OHLC chart. You can achieve this by navigating to “New Project” > “Chart” and selecting “OHLC” from the available chart types:
Next, proceed to the data step. Here, select “Link data” and copy the URL from your Google Spreadsheet. It’s important to note that for our visualization, the volume column (Column F) from our sheet is not relevant. We only require data from Columns A to E. Specify “A” as the “Start cell” and “E” as the “End cell,” then click “Connect data”
Drawing from your previous experiences, you should now be well-equipped to customize your chart with titles, annotations, and styling to create a visually compelling representation of the OHLC data.
Visualize trade volumes of a particular stock
Let’s explore another practical scenario in this chapter. Here, we’ll visualize the trading volumes of a specific stock over time using a column chart. The final result will resemble the chart you can view here:
If you’ve followed the previous examples in this document, you’ll find this task quite straightforward.
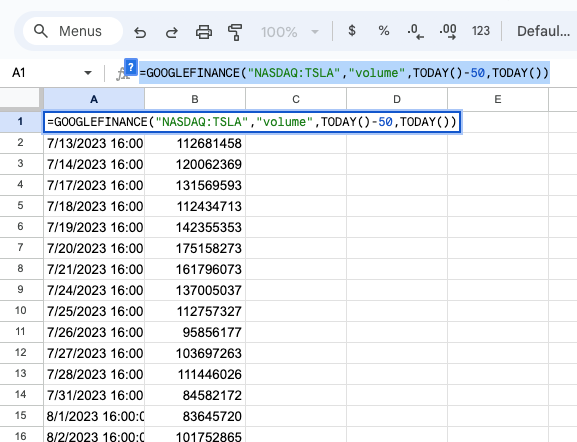
For this demonstration, we’ll fetch volume data from the Google Finance API. Start by inserting the following formula into the first cell of a new sheet:
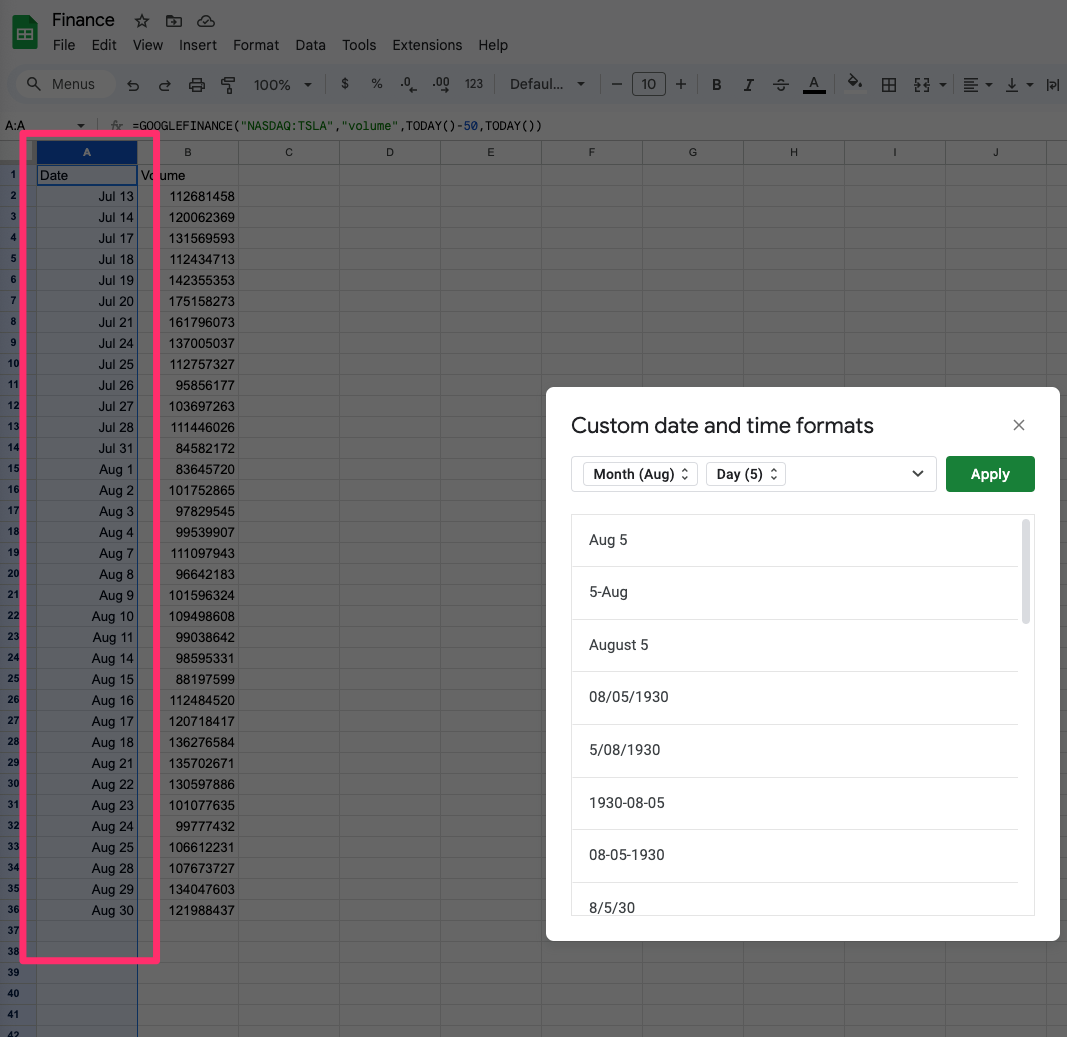
=GOOGLEFINANCE("NASDAQ:TSLA","volume",TODAY()-50,TODAY())Your sheet should appear similar to the following screenshot:
Here’s another useful technique within Google Sheets that will enhance the presentation of values on our x-axis. To implement it, select Column A, navigate to Format > Number > Custom date and time, and opt for a custom format. For instance, we’ve opted to display only the abbreviated month name and day, as demonstrated in this screenshot:
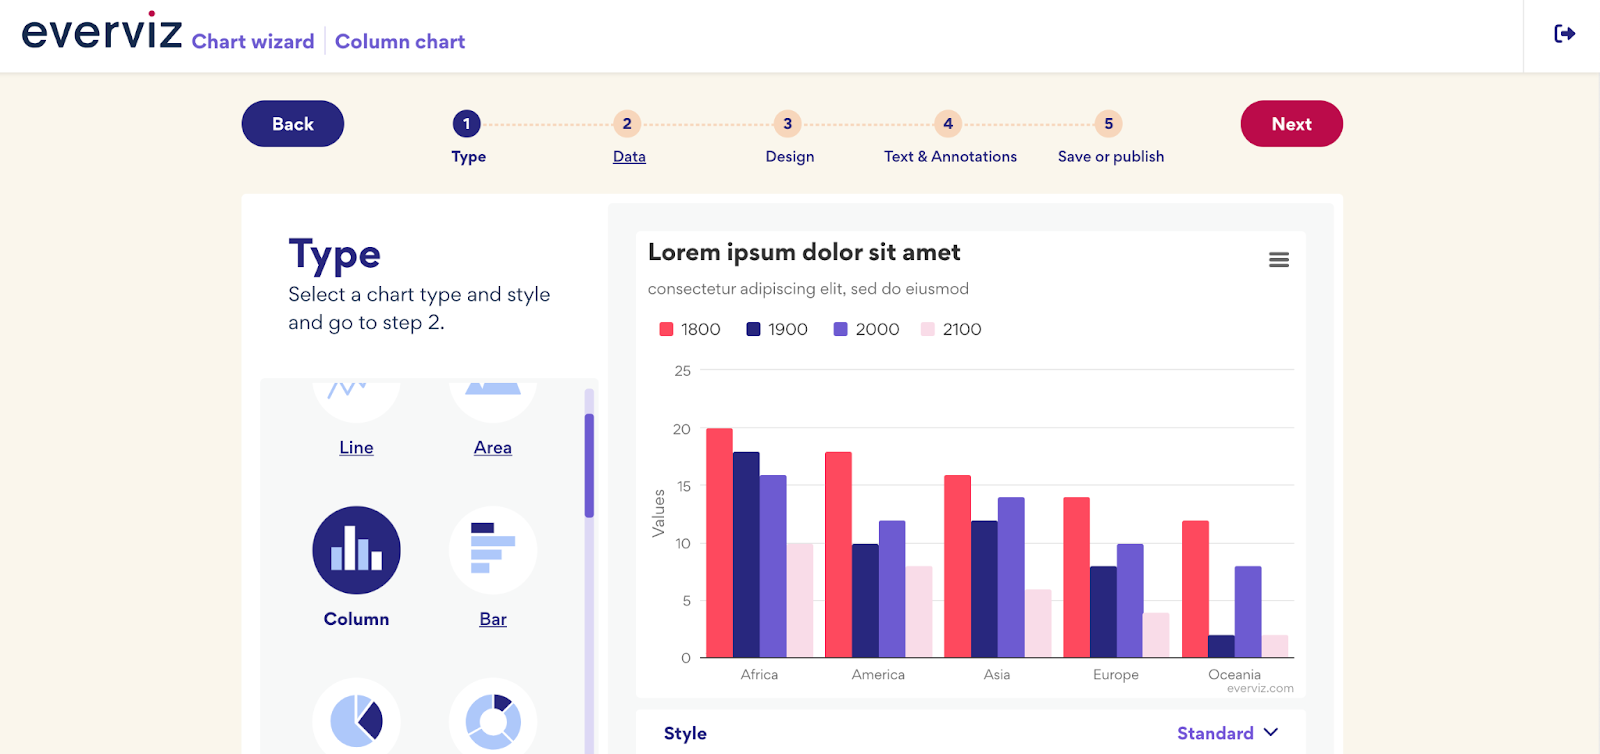
In everviz, create a new bar column chart and link data from your newly created sheet
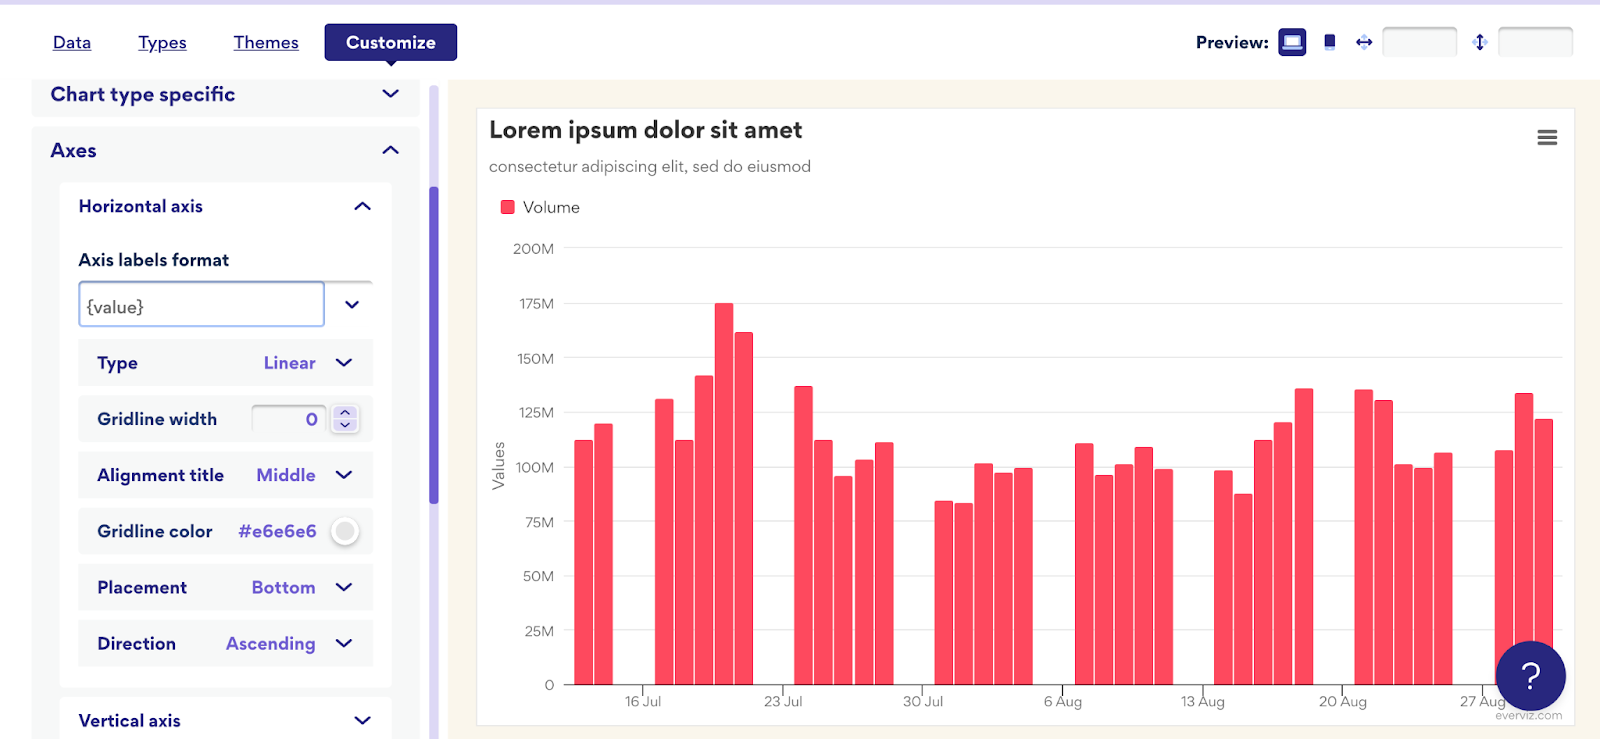
By default, everviz will interpret your data as dates, but you’ll notice that you have empty values during weekends when the stock exchanges are closed
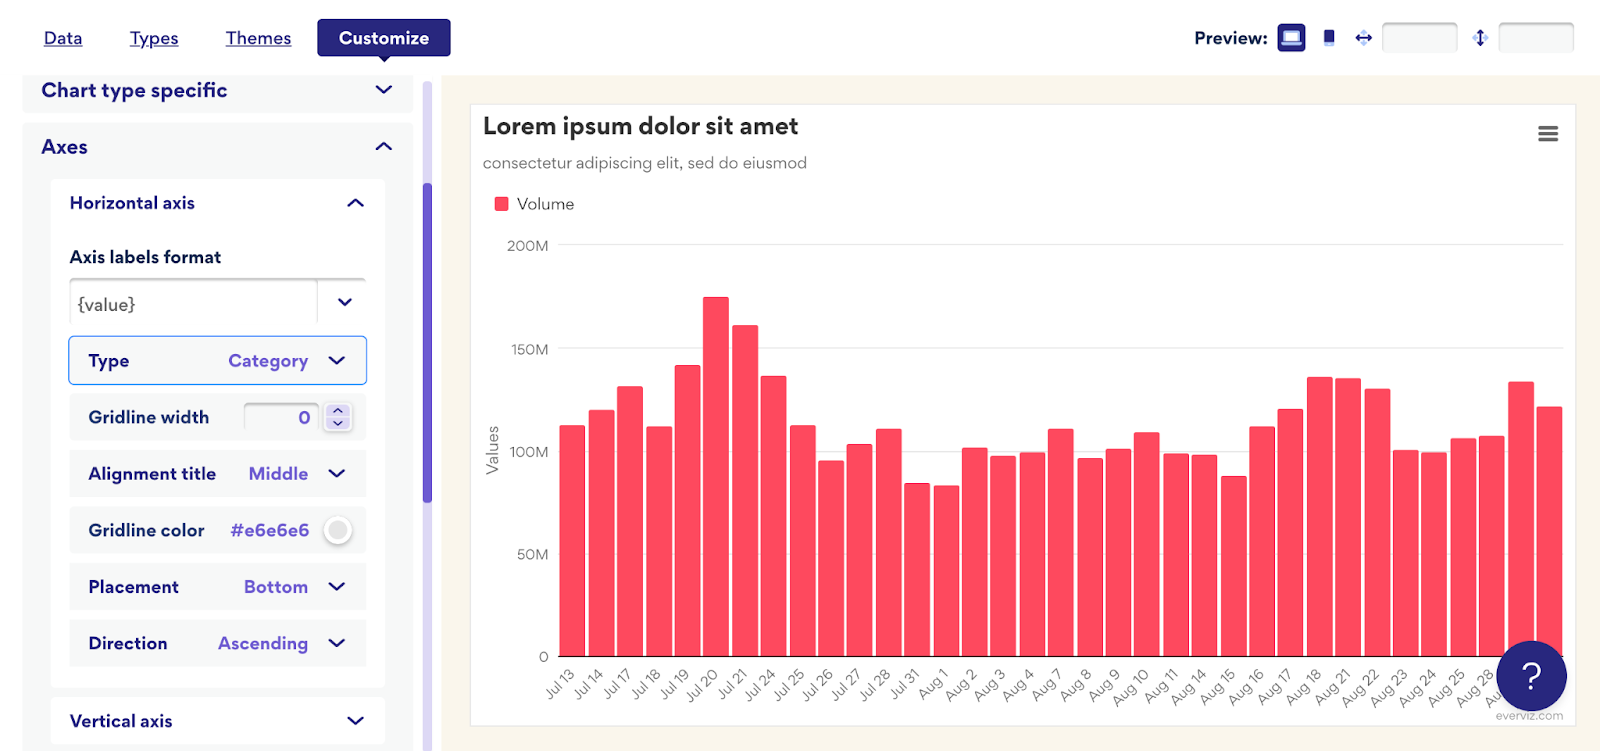
You can fix this by going to the editor and change the horizontal axis into a category axis
Visualize your investment portfolio
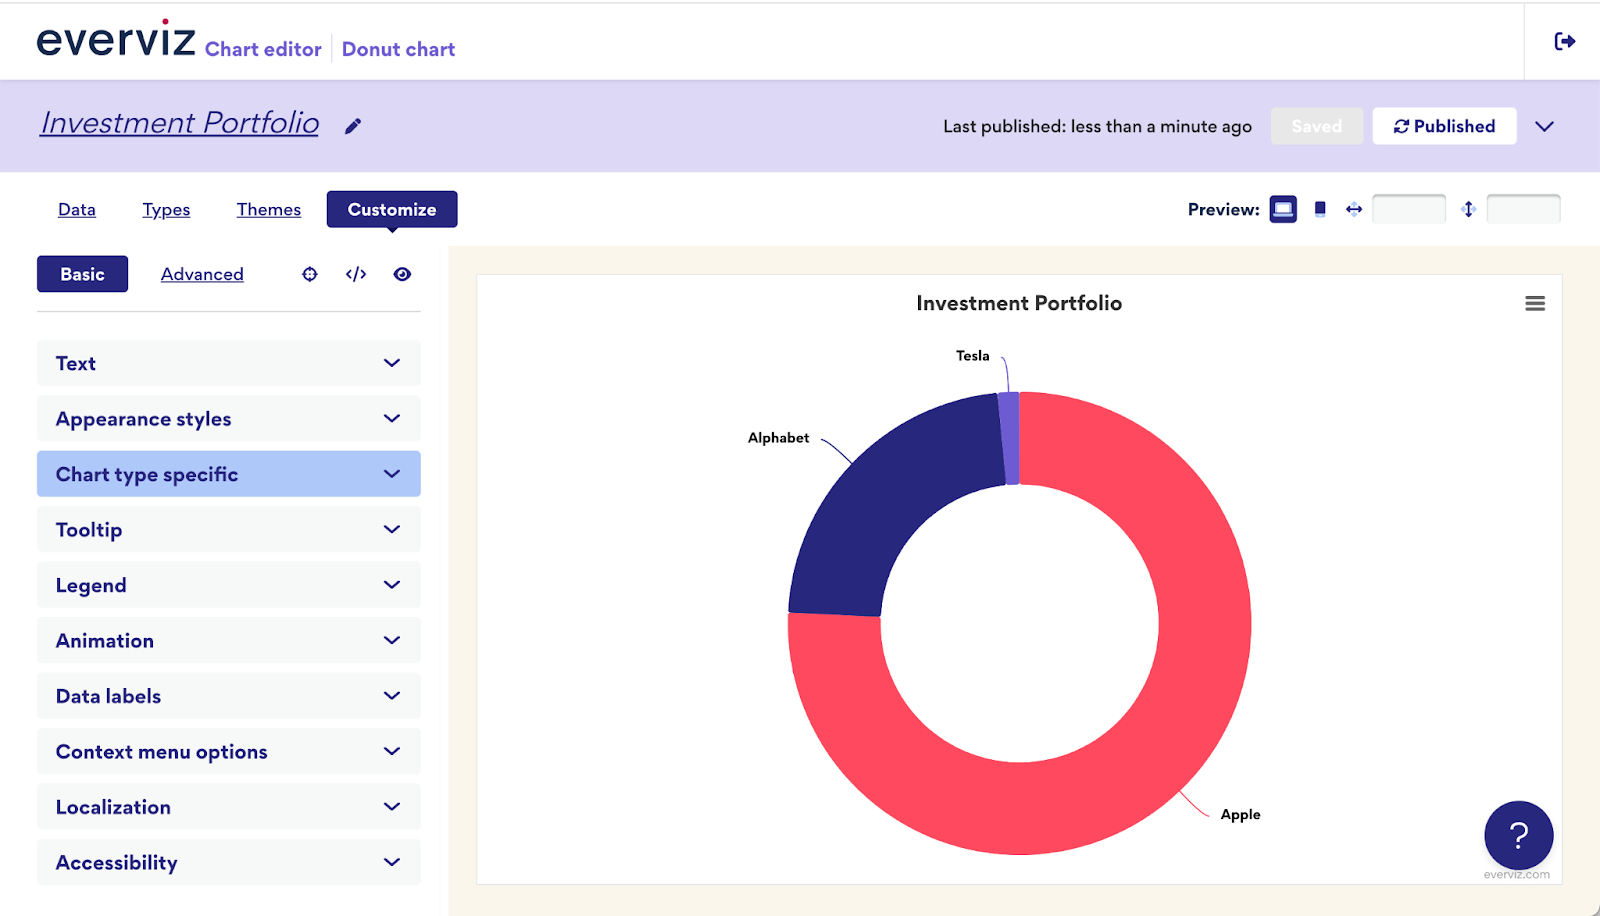
In the upcoming example, we’ll embark on visualizing a fictional portfolio consisting of stocks from Google, Alphabet, and Tesla. Our objective is to represent this stock portfolio using a pie chart, structured as follows:
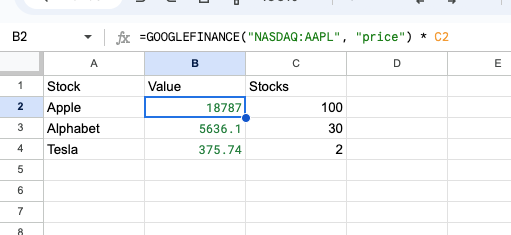
To get started, you’ll need to set up a new Google Sheet and begin inputting the details of your stocks and their respective ownership percentages. Here’s a straightforward illustration of how your sheet might appear:
Once you’ve prepared your data in the Google Sheet, the next step is equally simple in everviz. Simply generate a fresh donut chart, connect it to your sheet, and tailor it to align with your branding.
Summary
In our article, we’ve demonstrated the effective utilization of GOOGLEFINANCE functions to extract financial data that can be seamlessly visualized using everviz. These examples represent just a glimpse of the possibilities. The sky’s the limit, and if you have any questions or seek further guidance, don’t hesitate to reach out to us using the form below.


