everviz blog.

Visualizing health data: Past, present, future

Let’s start with a few key statistics. Healthcare takes more than 10% of the GDP of most developed countries. In fact, in 2020, 21% of the US GDP was spent on healthcare. That is more than any other US program. Healthcare amounted to 12.8% of the GDP in the UK and 11.3% of the GDP in Norway.

2021 in review

Another strange year is soon coming to an end. Also this year has hit various businesses, communities and individuals hard. On top of that, the

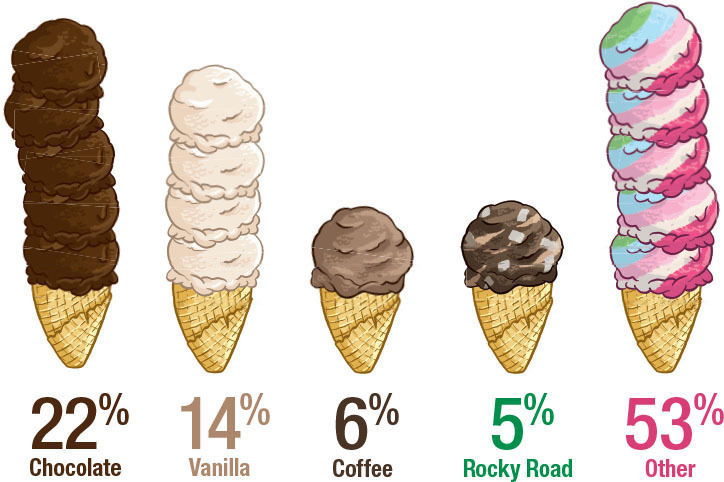
Favorite ice cream

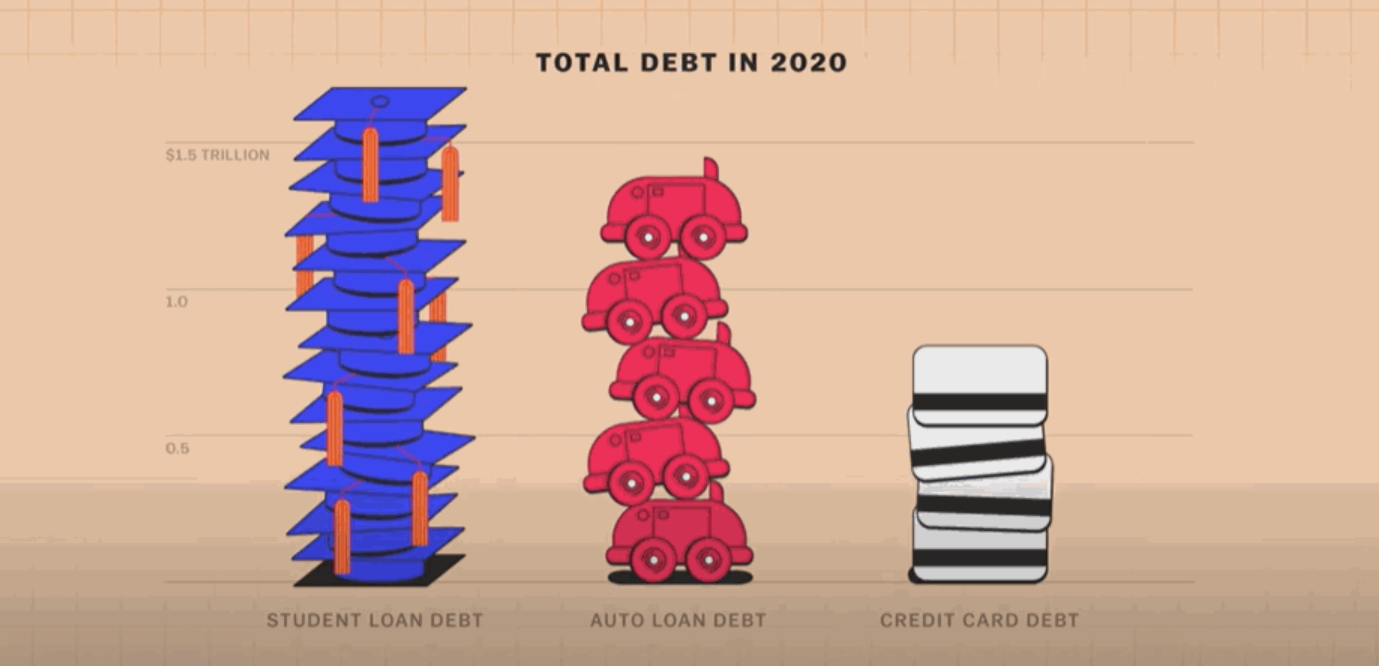
Lies, damned lies, and visualizations

Graphs can be a wonderful tool to make data clear, engaging, and accessible to your audience. However, picking the right data visualization to communicate your story can be hard.

Data visualization for marketing

Data visualization for marketing

Data visualizations are an excellent marketing tool with a wide range of potential uses. Visuals can be a powerful addition to a marketing campaign.  They

Choosing the right visualization for your data

Choosing the right visualization for your data

Data visualizations are a great way of communicating anything numerical with your audience.  Perhaps you want to share the results of a survey or maybe you want to illustrate the differences between two products?

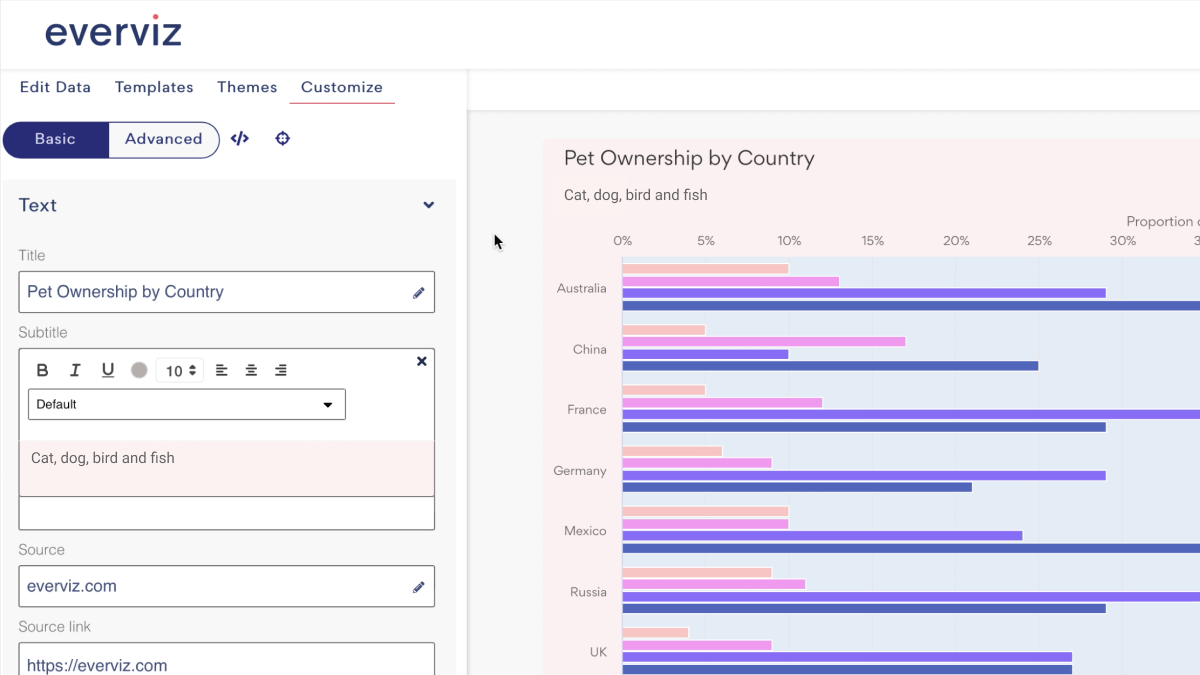
Picture of the new text edit features in the everviz editor

More efficient text editing

Adding texts to your visualizations is now simpler than ever. With the latest update of everviz, you now have access to editing all texts in

Explanatory Data Visualization with everviz

Explanatory data visualization with everviz

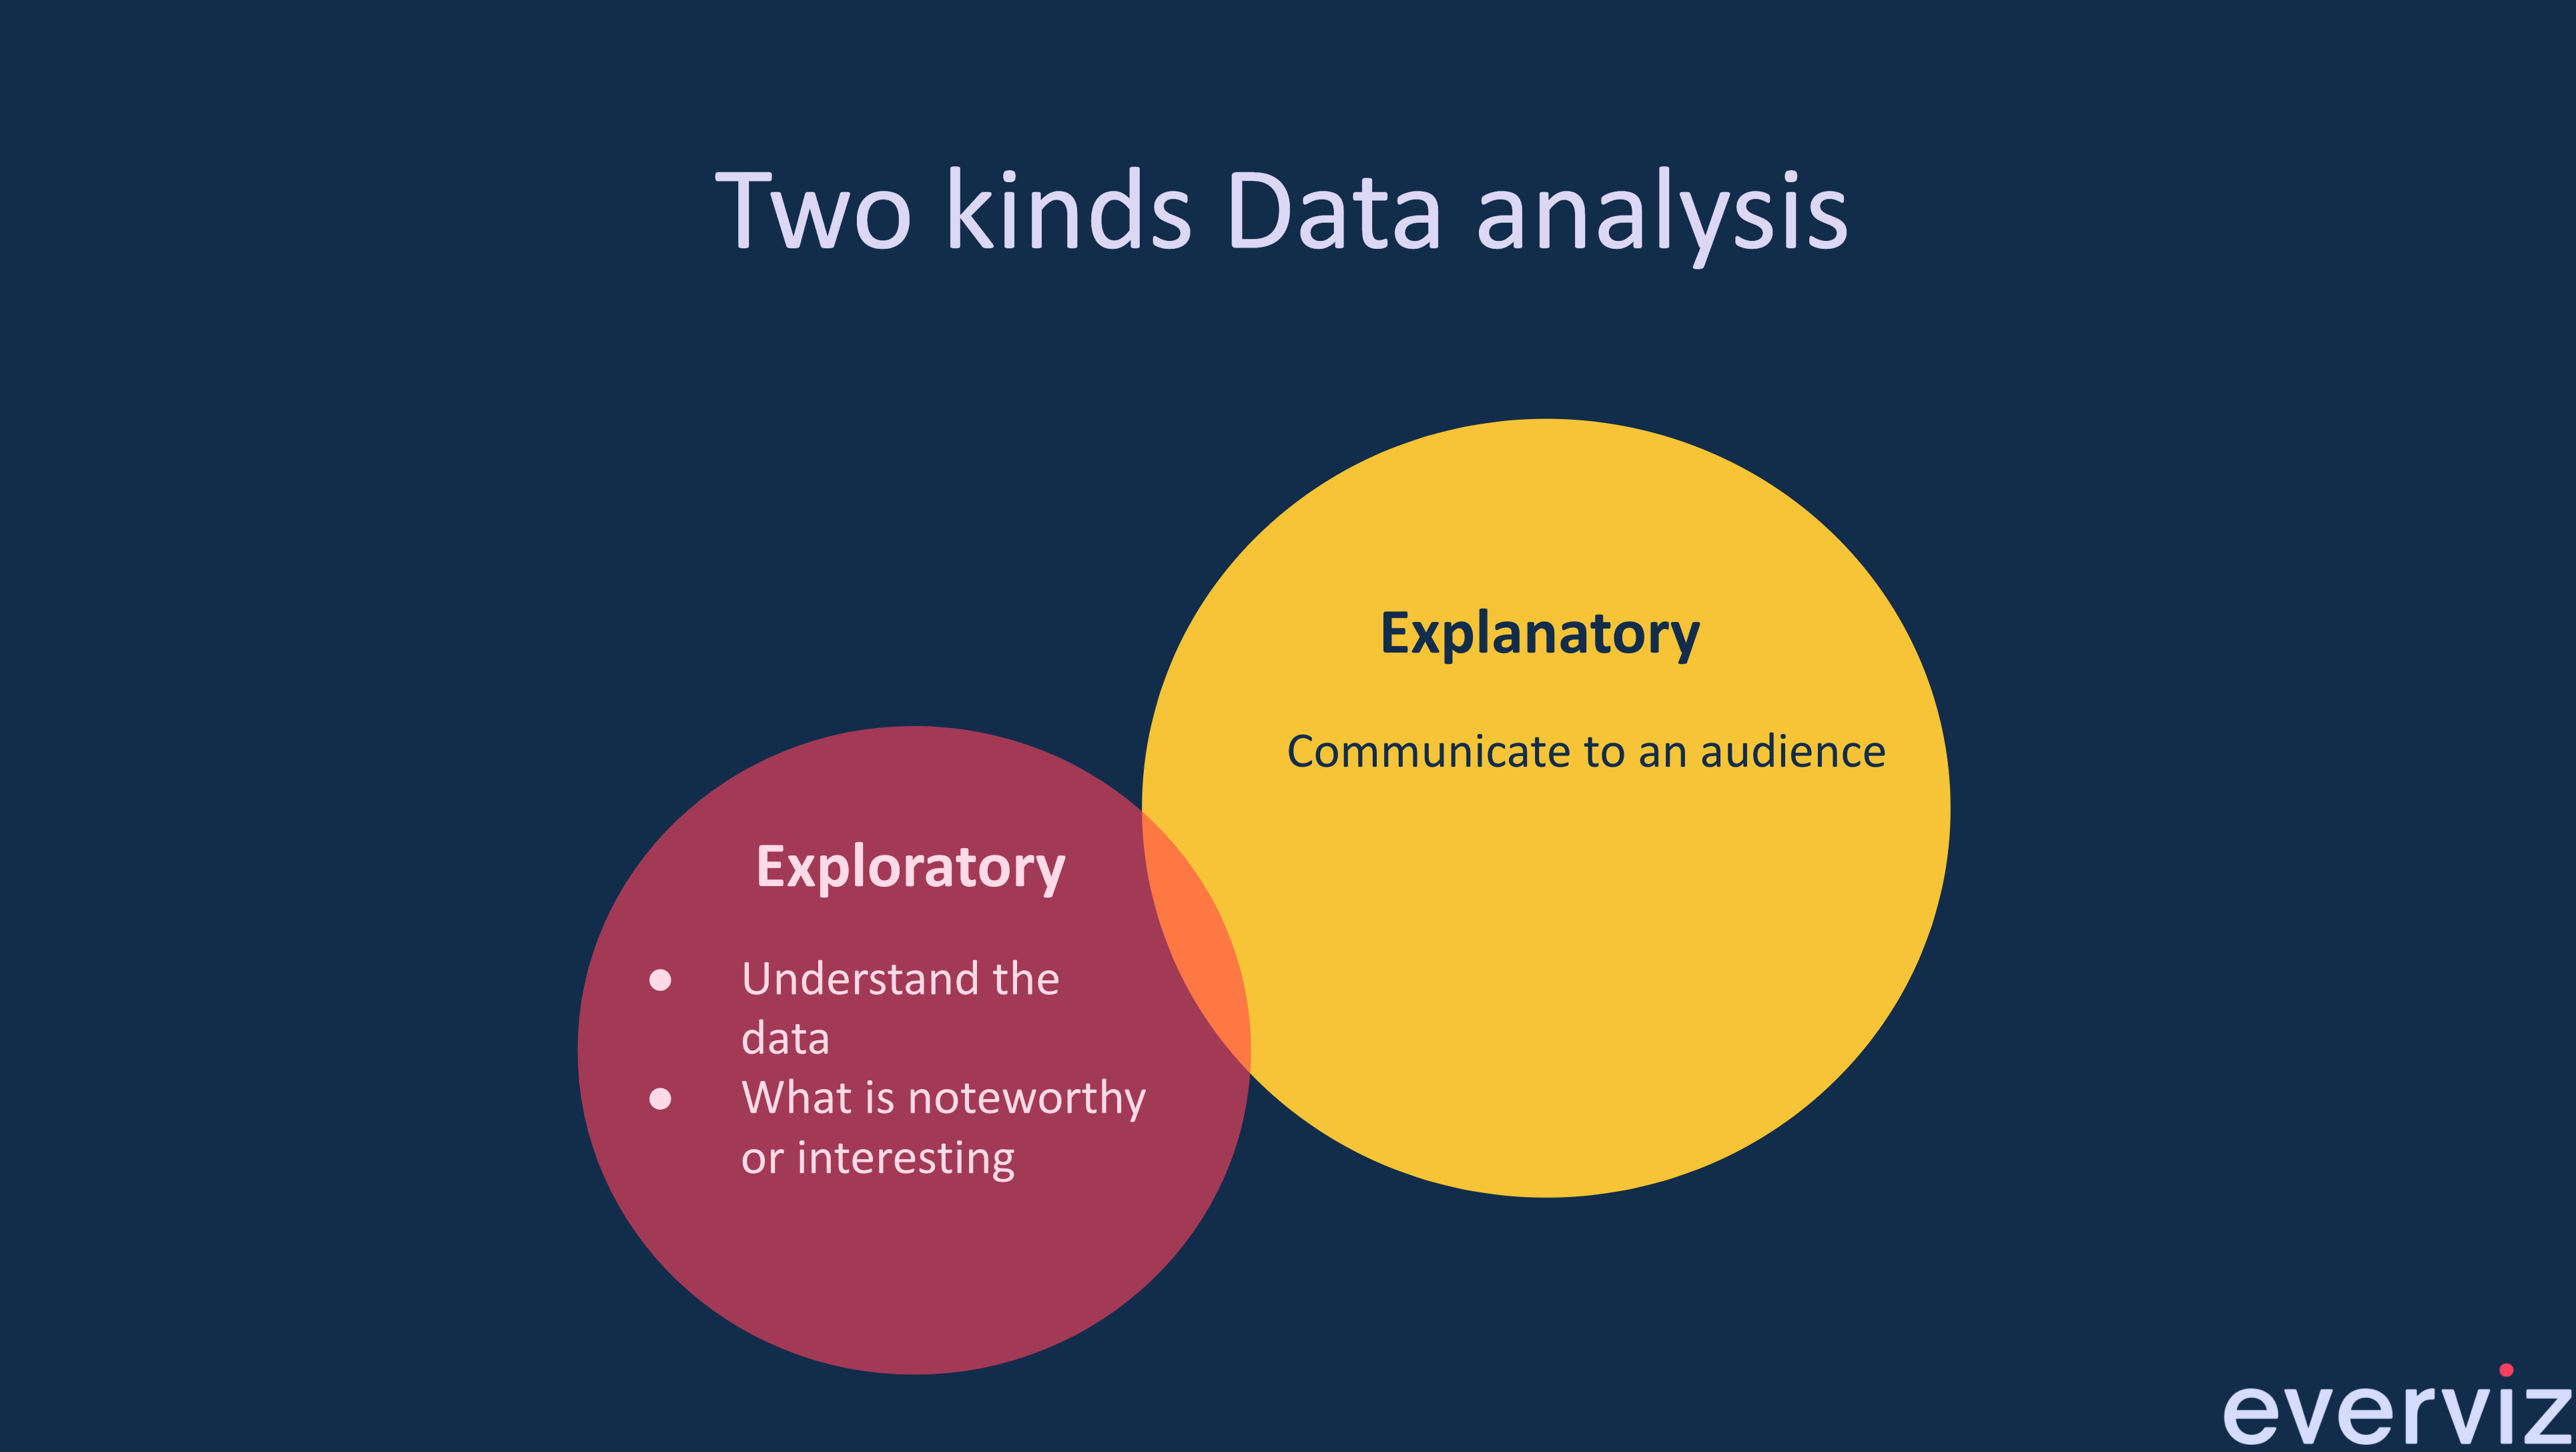
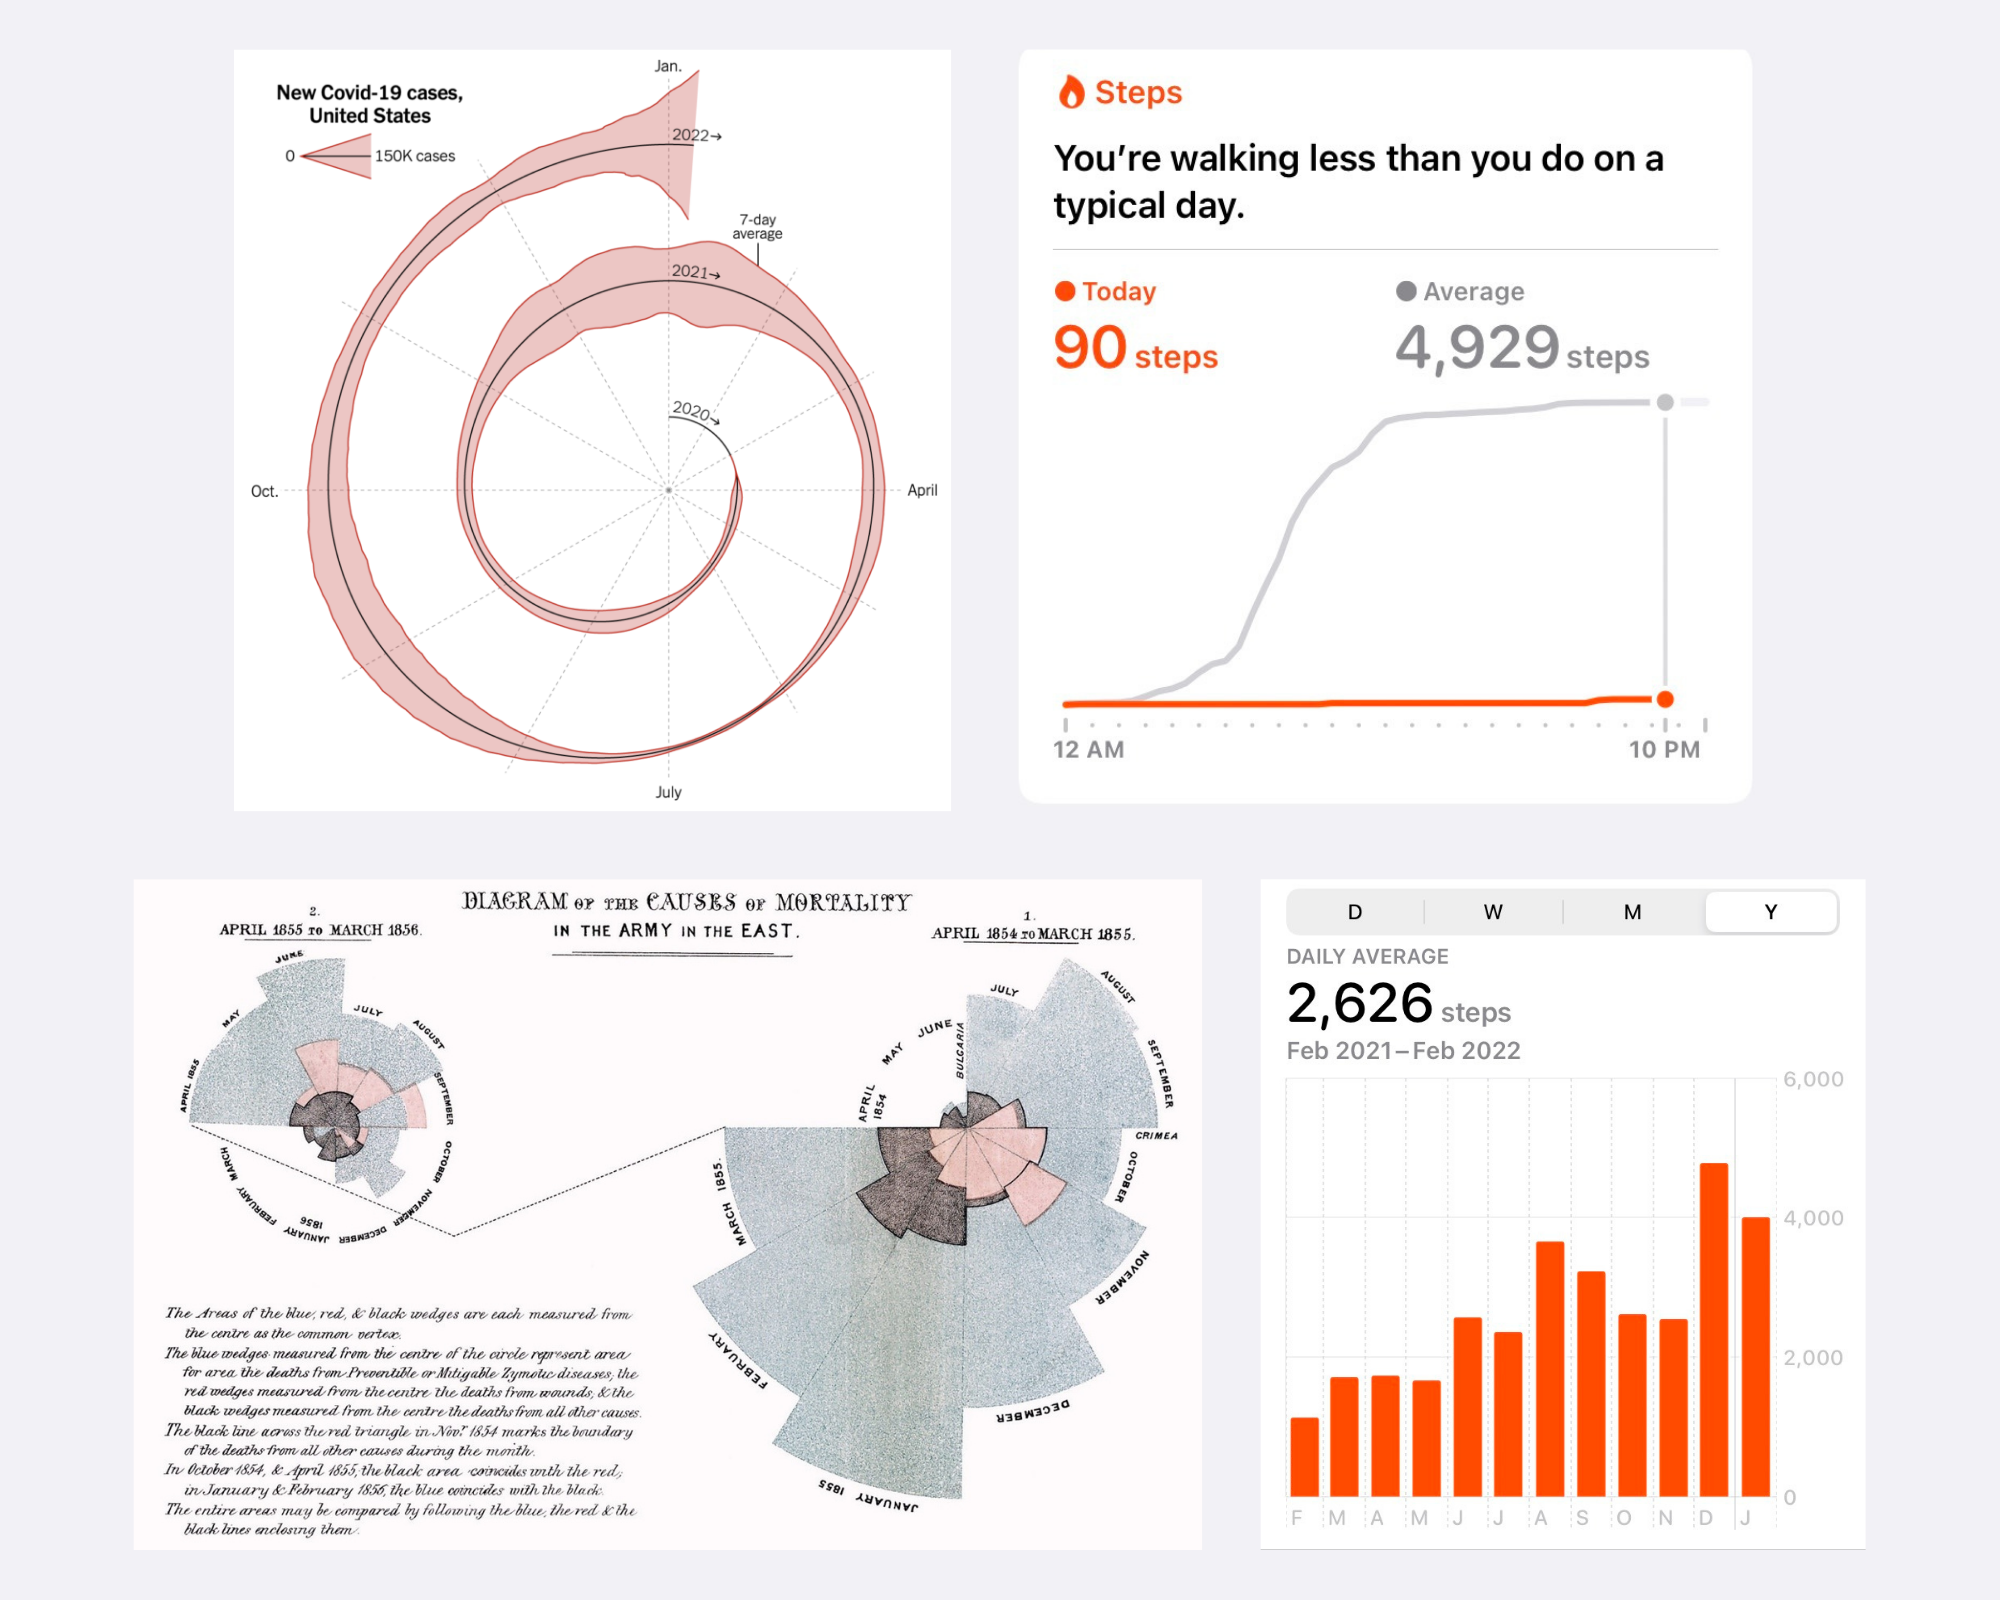
What is the difference between exploratory and explanatory data Visualization? Exploratory Data Visualizations are charts or graphs that are usually created during the data analysis

Are-Interactive-Graphs-Here-to-Stay

Are interactive graphs here to stay?

This is a guest blog post by Rebeca Pop, founder of Vizlogue, a Data Visualization and Storytelling Lab that offers workshops and consulting services. You