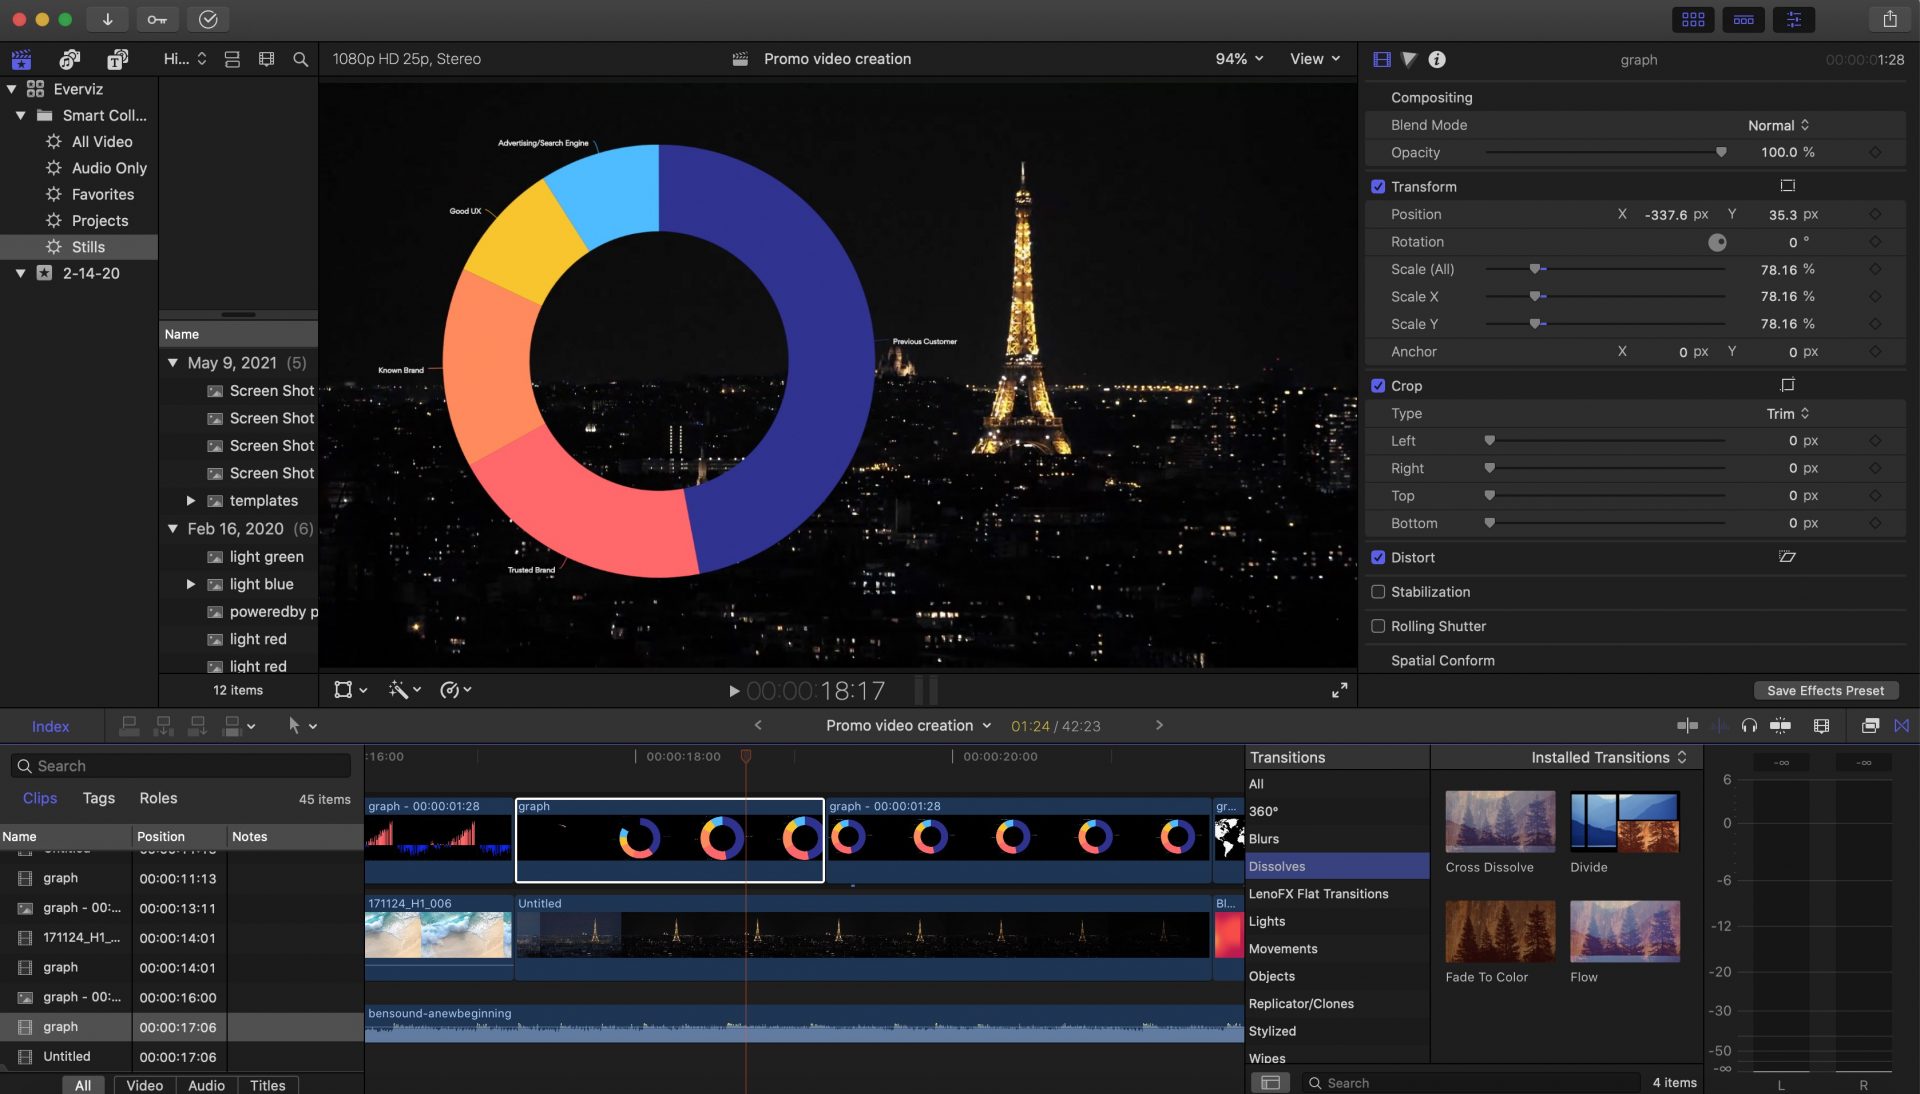
New: Animated visualizations in your videos
We’re excited to share with you a new feature in beta: Download project as video Our mission is to make it easy for anyone to
We’re excited to share with you a new feature in beta: Download project as video Our mission is to make it easy for anyone to

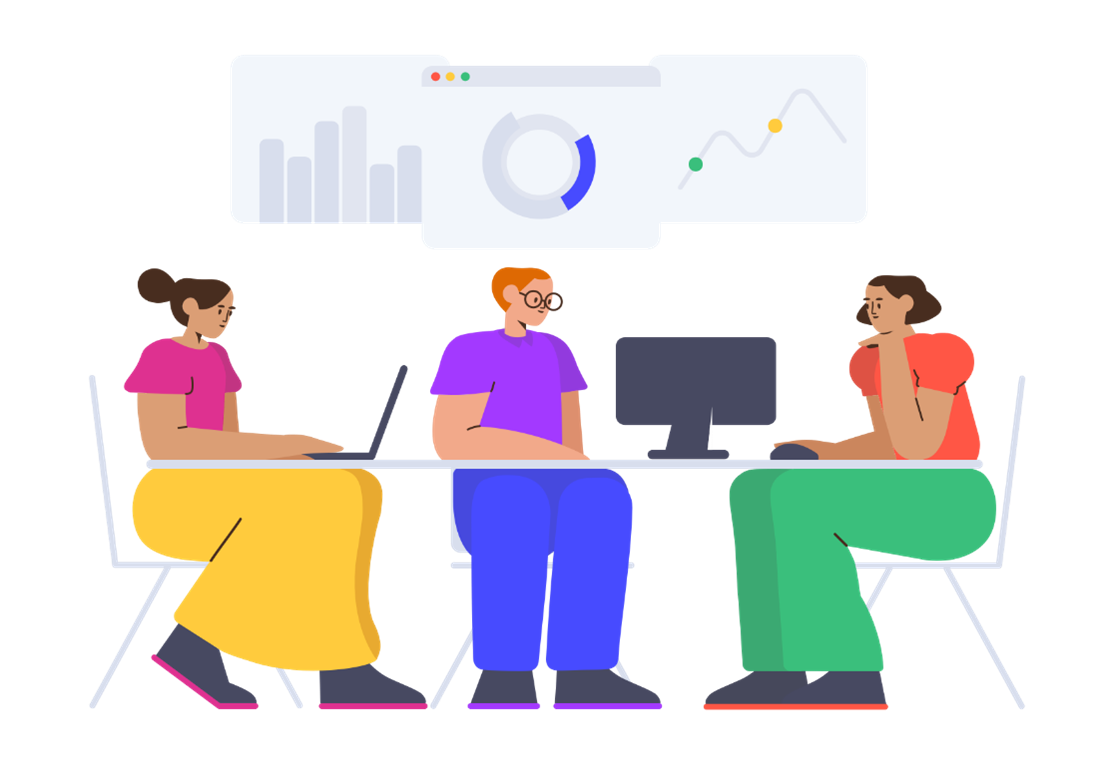
Imagine this scenario. Alex is an analyst working for a biotech company. He joined the organization two weeks ago. His manager calls him into her office and asks him to prepare a presentation for a few executives.

Let me ask you this: Do you recall the first time you created a graph? I still have a vivid memory of the first time that I designed one. I was in my first year of college and had to visualize data for my Statistics class.
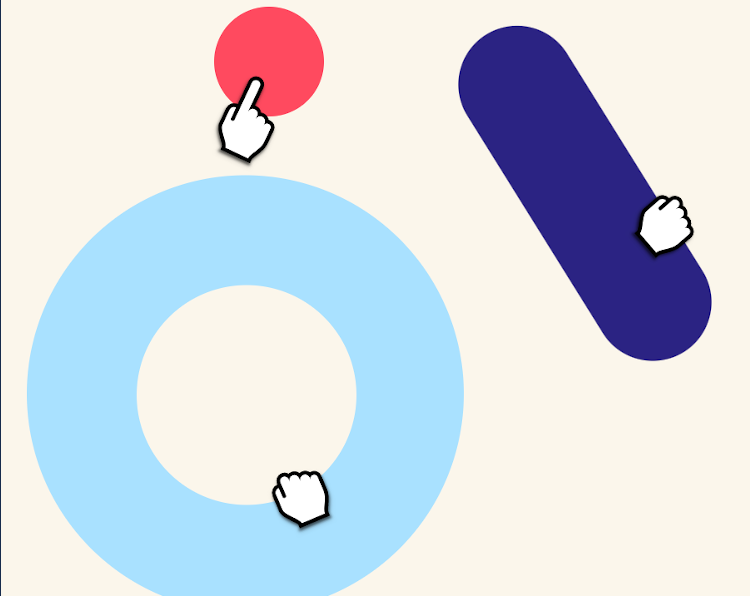
At everviz, we aim to keep things simple, yet powerful. These are two orthogonal (independent) adjectives, and almost like describing something that is red, yet
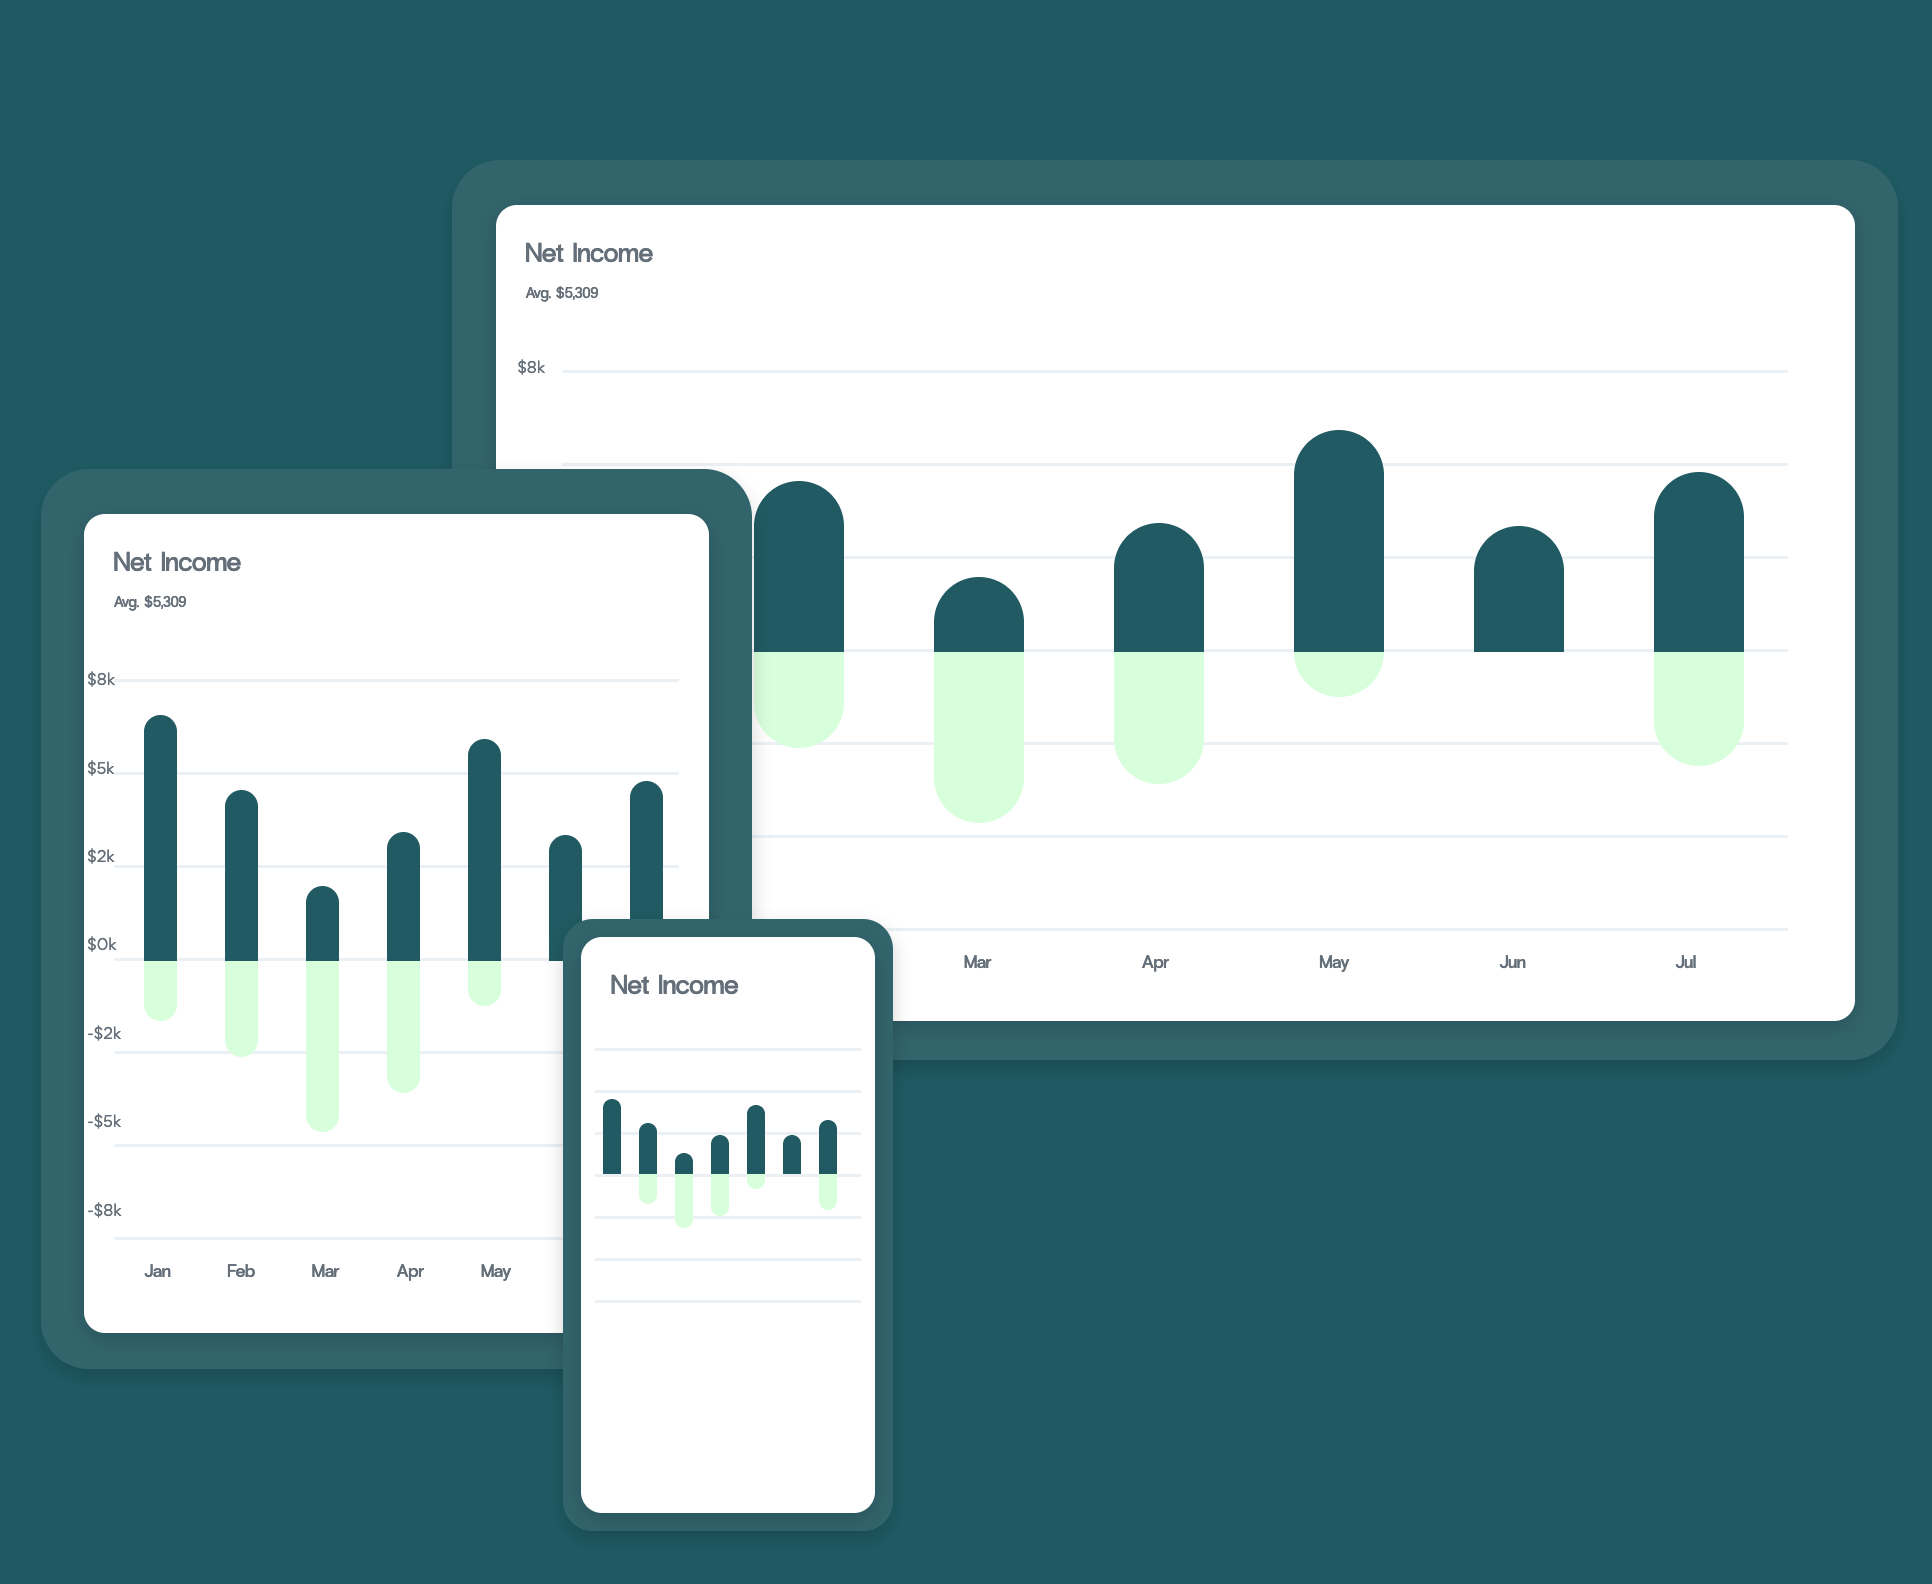
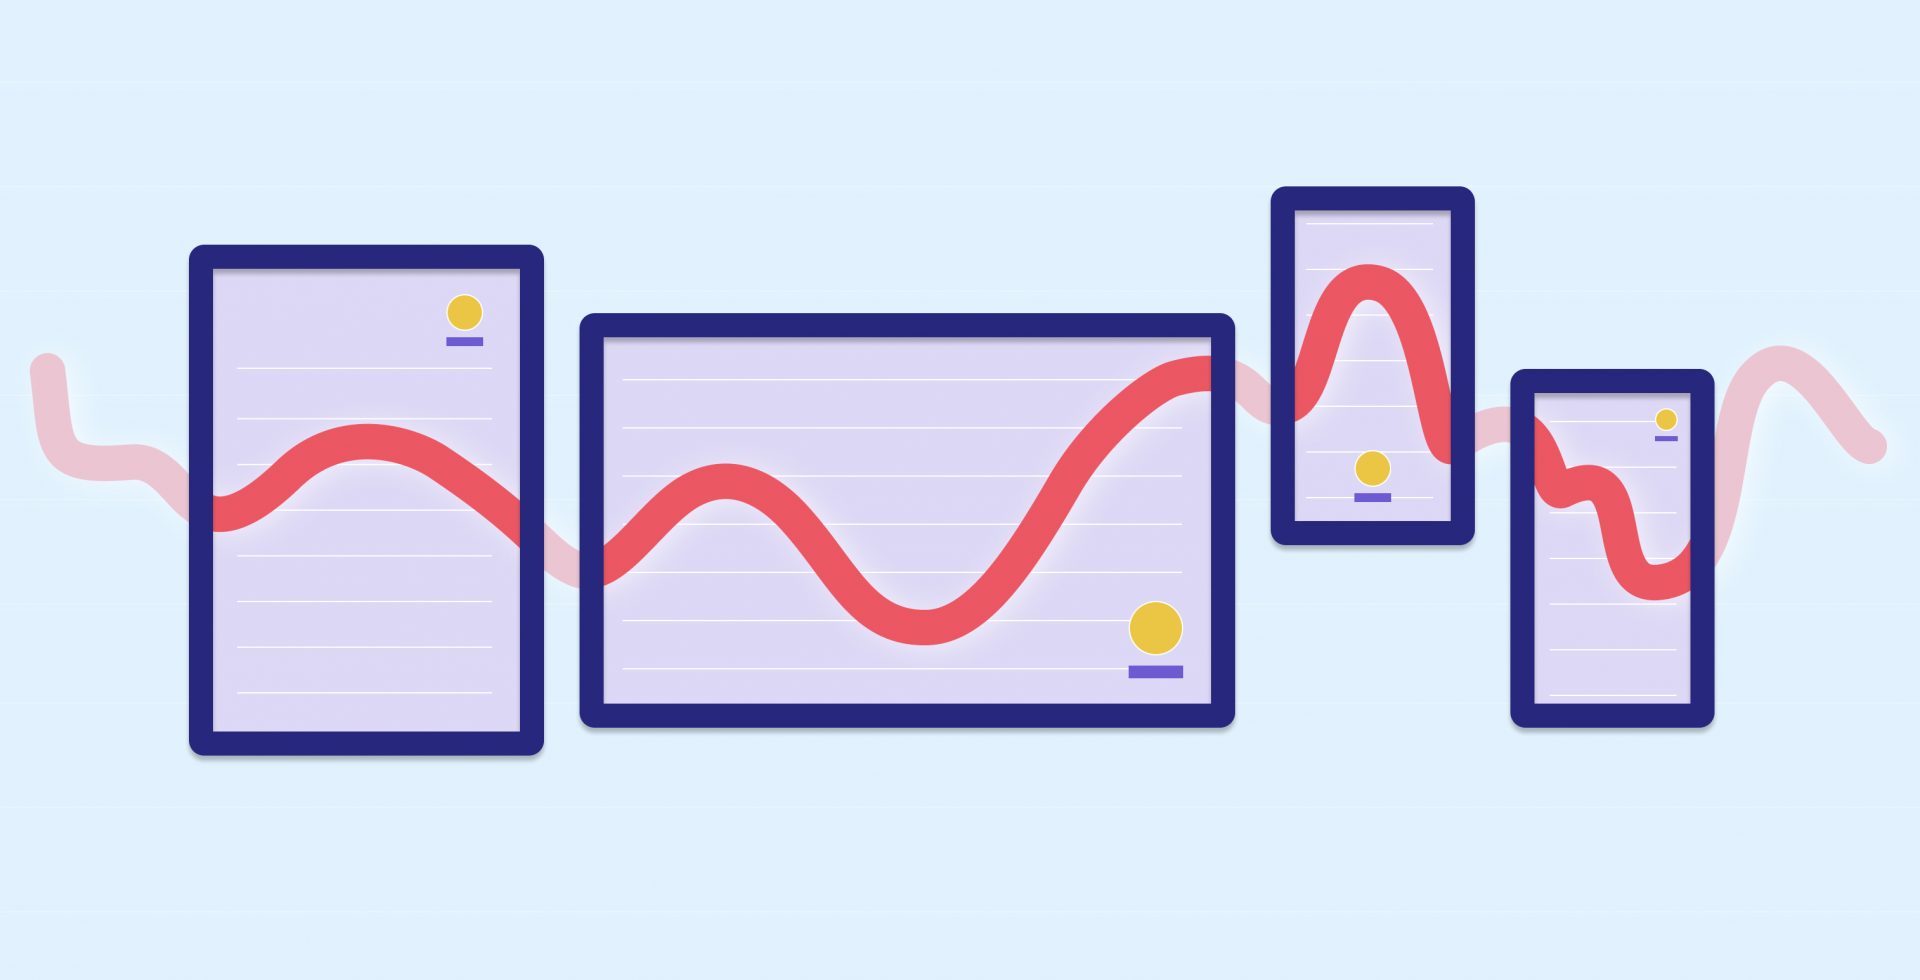
You may not be a web designer, but if your bread and butter is offering services to your audience through a website, “responsive” versus “static”
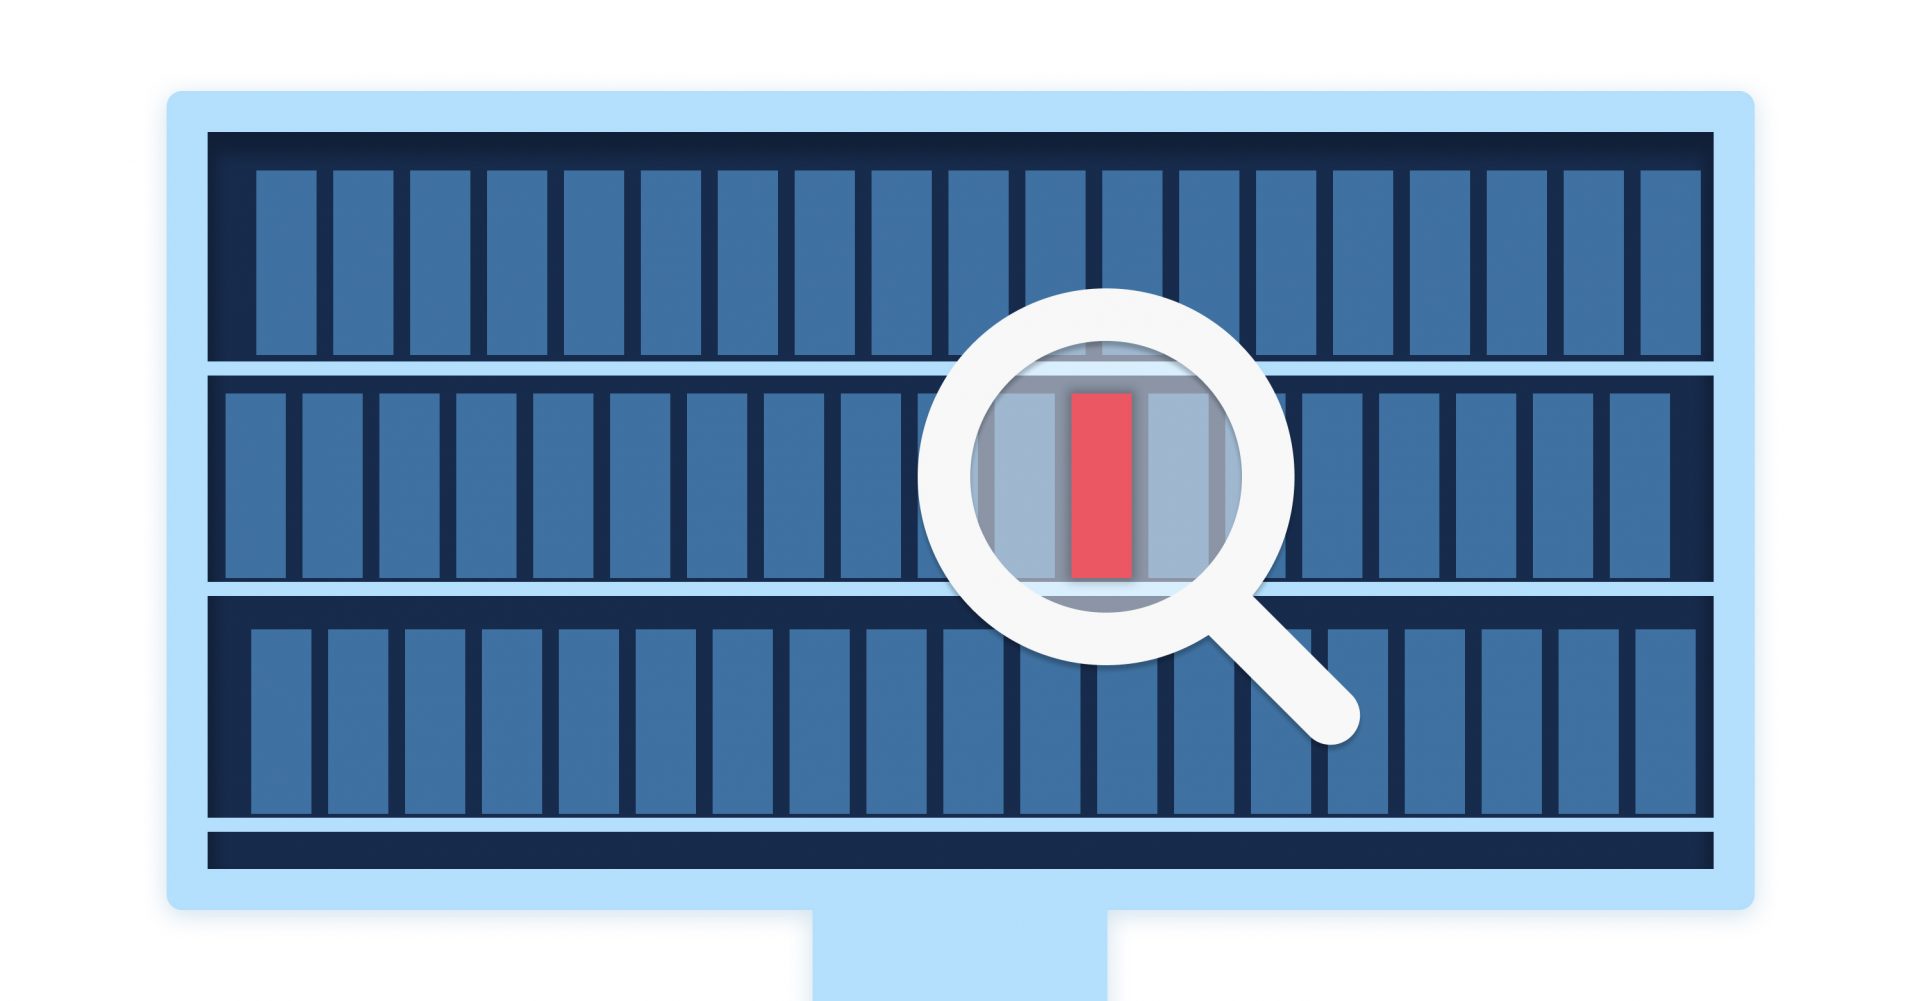
While I am not arguing that you should forget altogether about pie charts, bar charts, and line charts, there are situations in which a more innovative chart type could work better.
So you want to make a chart? Do you have data? I’m assuming that’s a “No,” if you’re reading this article. Well let me tell
Here at everviz, we strongly believe in the power of branding. That’s why we’ve built in full customization capabilities, so that you can align your
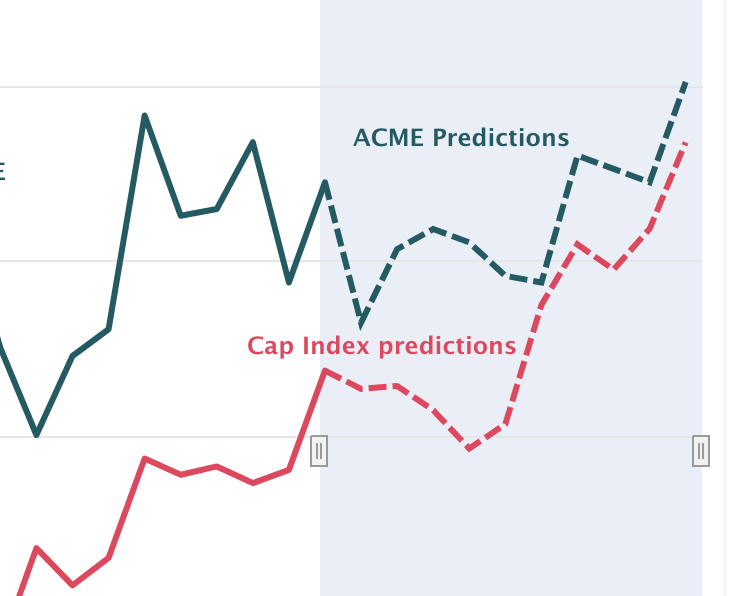
Reference Lines, Plot Bands, arrows, ranges or goal lines! These are just a few ways you can Highlight your data to help your audience better

We have some exciting news to our customers on a WordPress platform. A new everviz WordPress plugin is available, which will help you manage everviz
If you’re trying to distinguish your brand and get readers to easily retain information and take action, one of the best things you can do
Here is a quick rundown of some of the features we have added to everviz recently. Improved annotations The annotations are now more reliable in
