
Announcing improved export server
We have just launched our next generation export server. This article explains what the export server is, why we redesigned it and how you can
We have just launched our next generation export server. This article explains what the export server is, why we redesigned it and how you can
We have been busy adding features to everviz that will help you become even more productive with visualizations. Follow us on Twitter or Facebook to

Here at everviz our mission is to enable our customers to reach out with content, news and insights to the largest possible audience. This means
We are the developer of everviz, a visualization tool made for helping journalists and Content Creators to tell complex stories in a simple way. Our
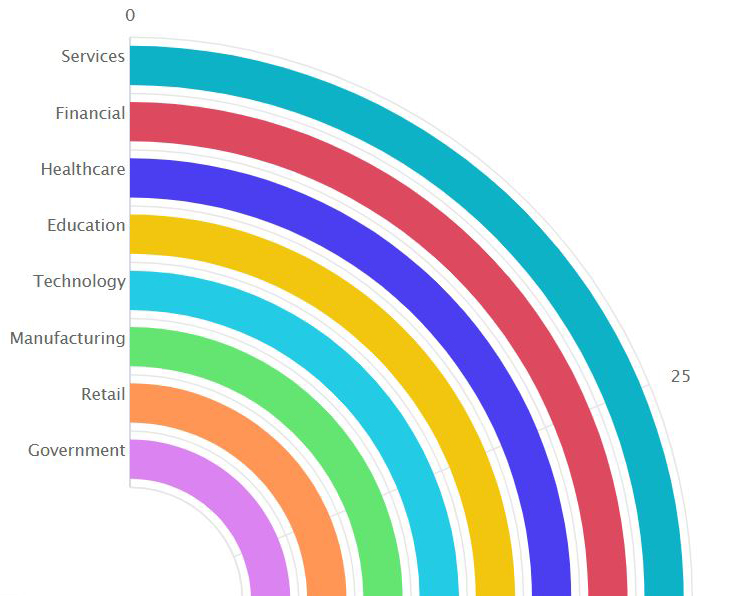
It can be difficult to communicate financial information to different audiences, but a well-designed graph or chart can help you to get your message across.

Pick the right color, make thoughtful chart choices, consider color-blindness, avoid clutter – you dive deep into each of these topics, master them, and, done! You are ready to start creating informative and effective data visualizations.
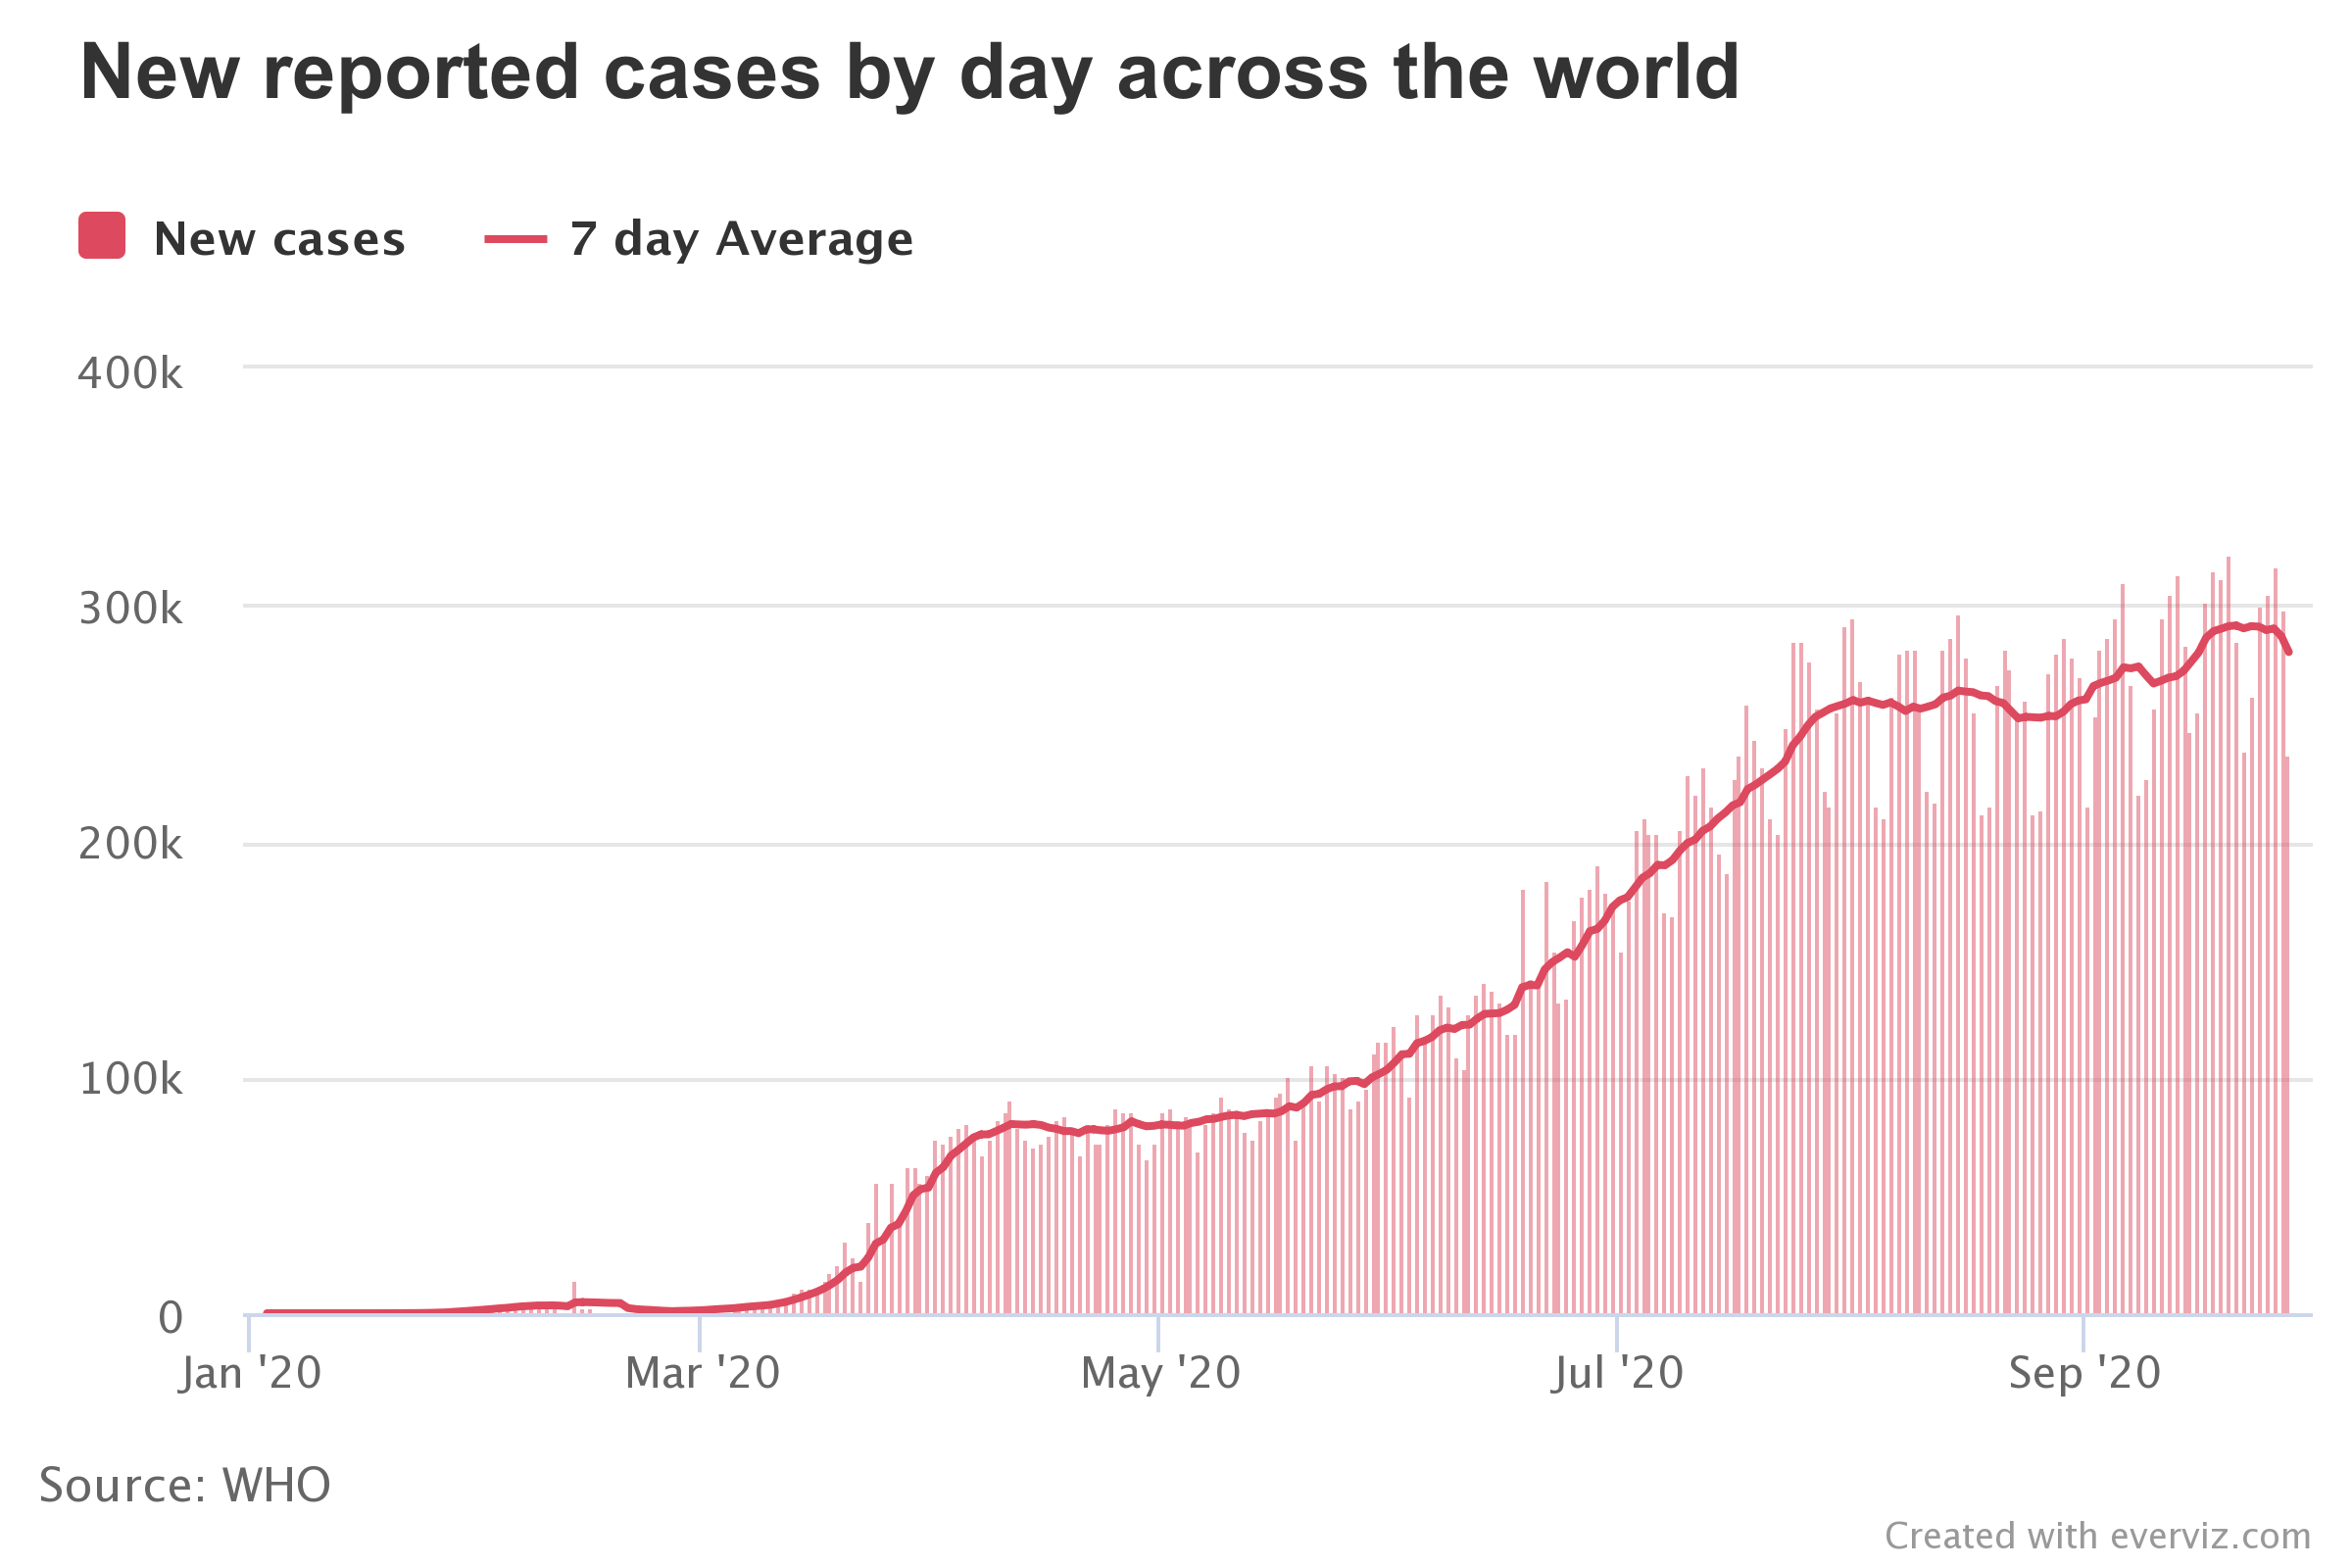
Covid graphs are all around us. In this article we show how you can create graphs like the Pros without help from programmers or designers.
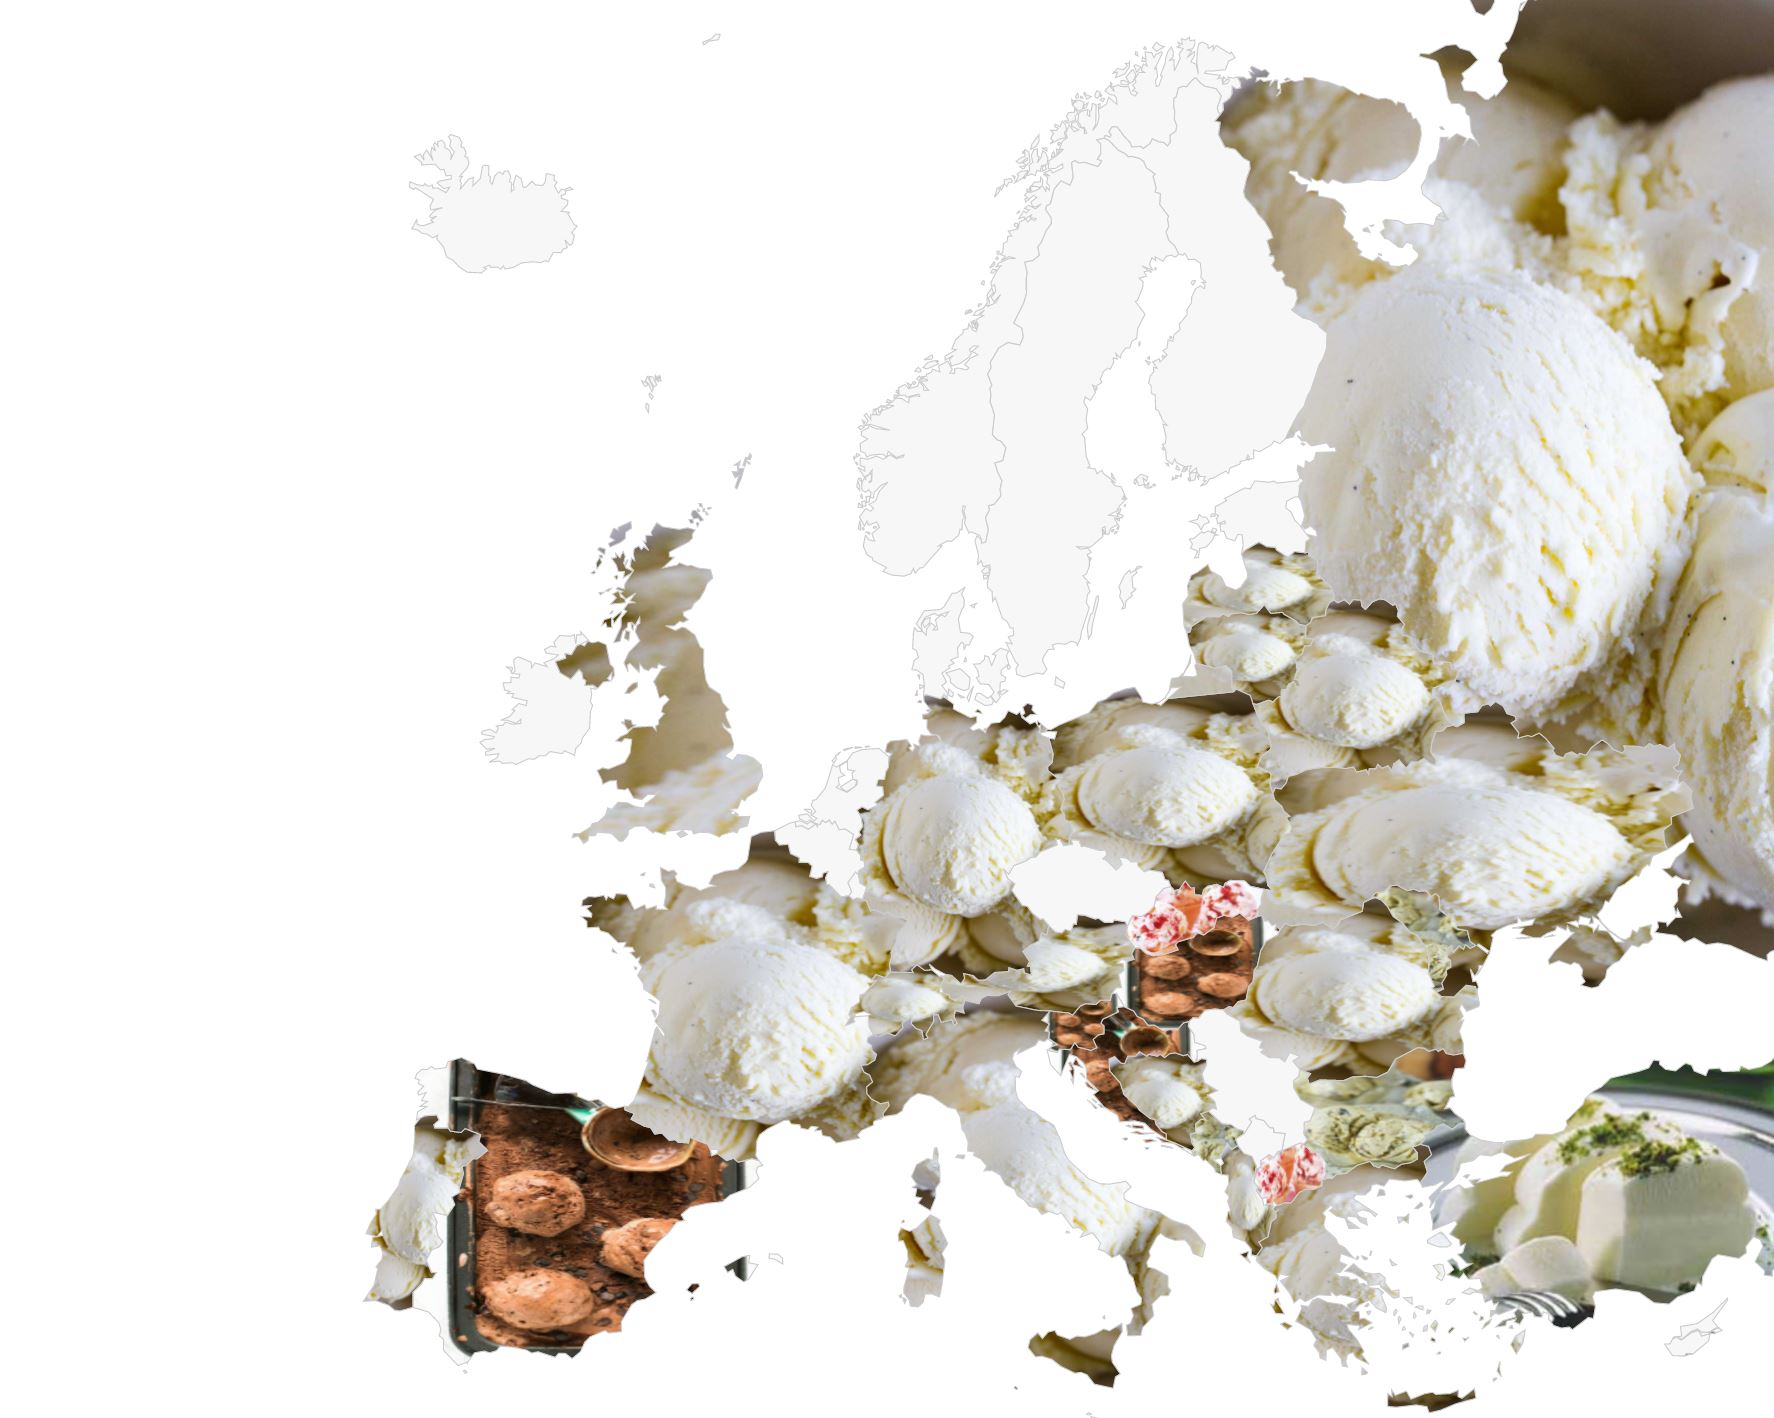
Jessica, our contributer from Cape Town, South Africa, has been playing around with the map features of everviz. Read her entertaining ice cream adventure! People
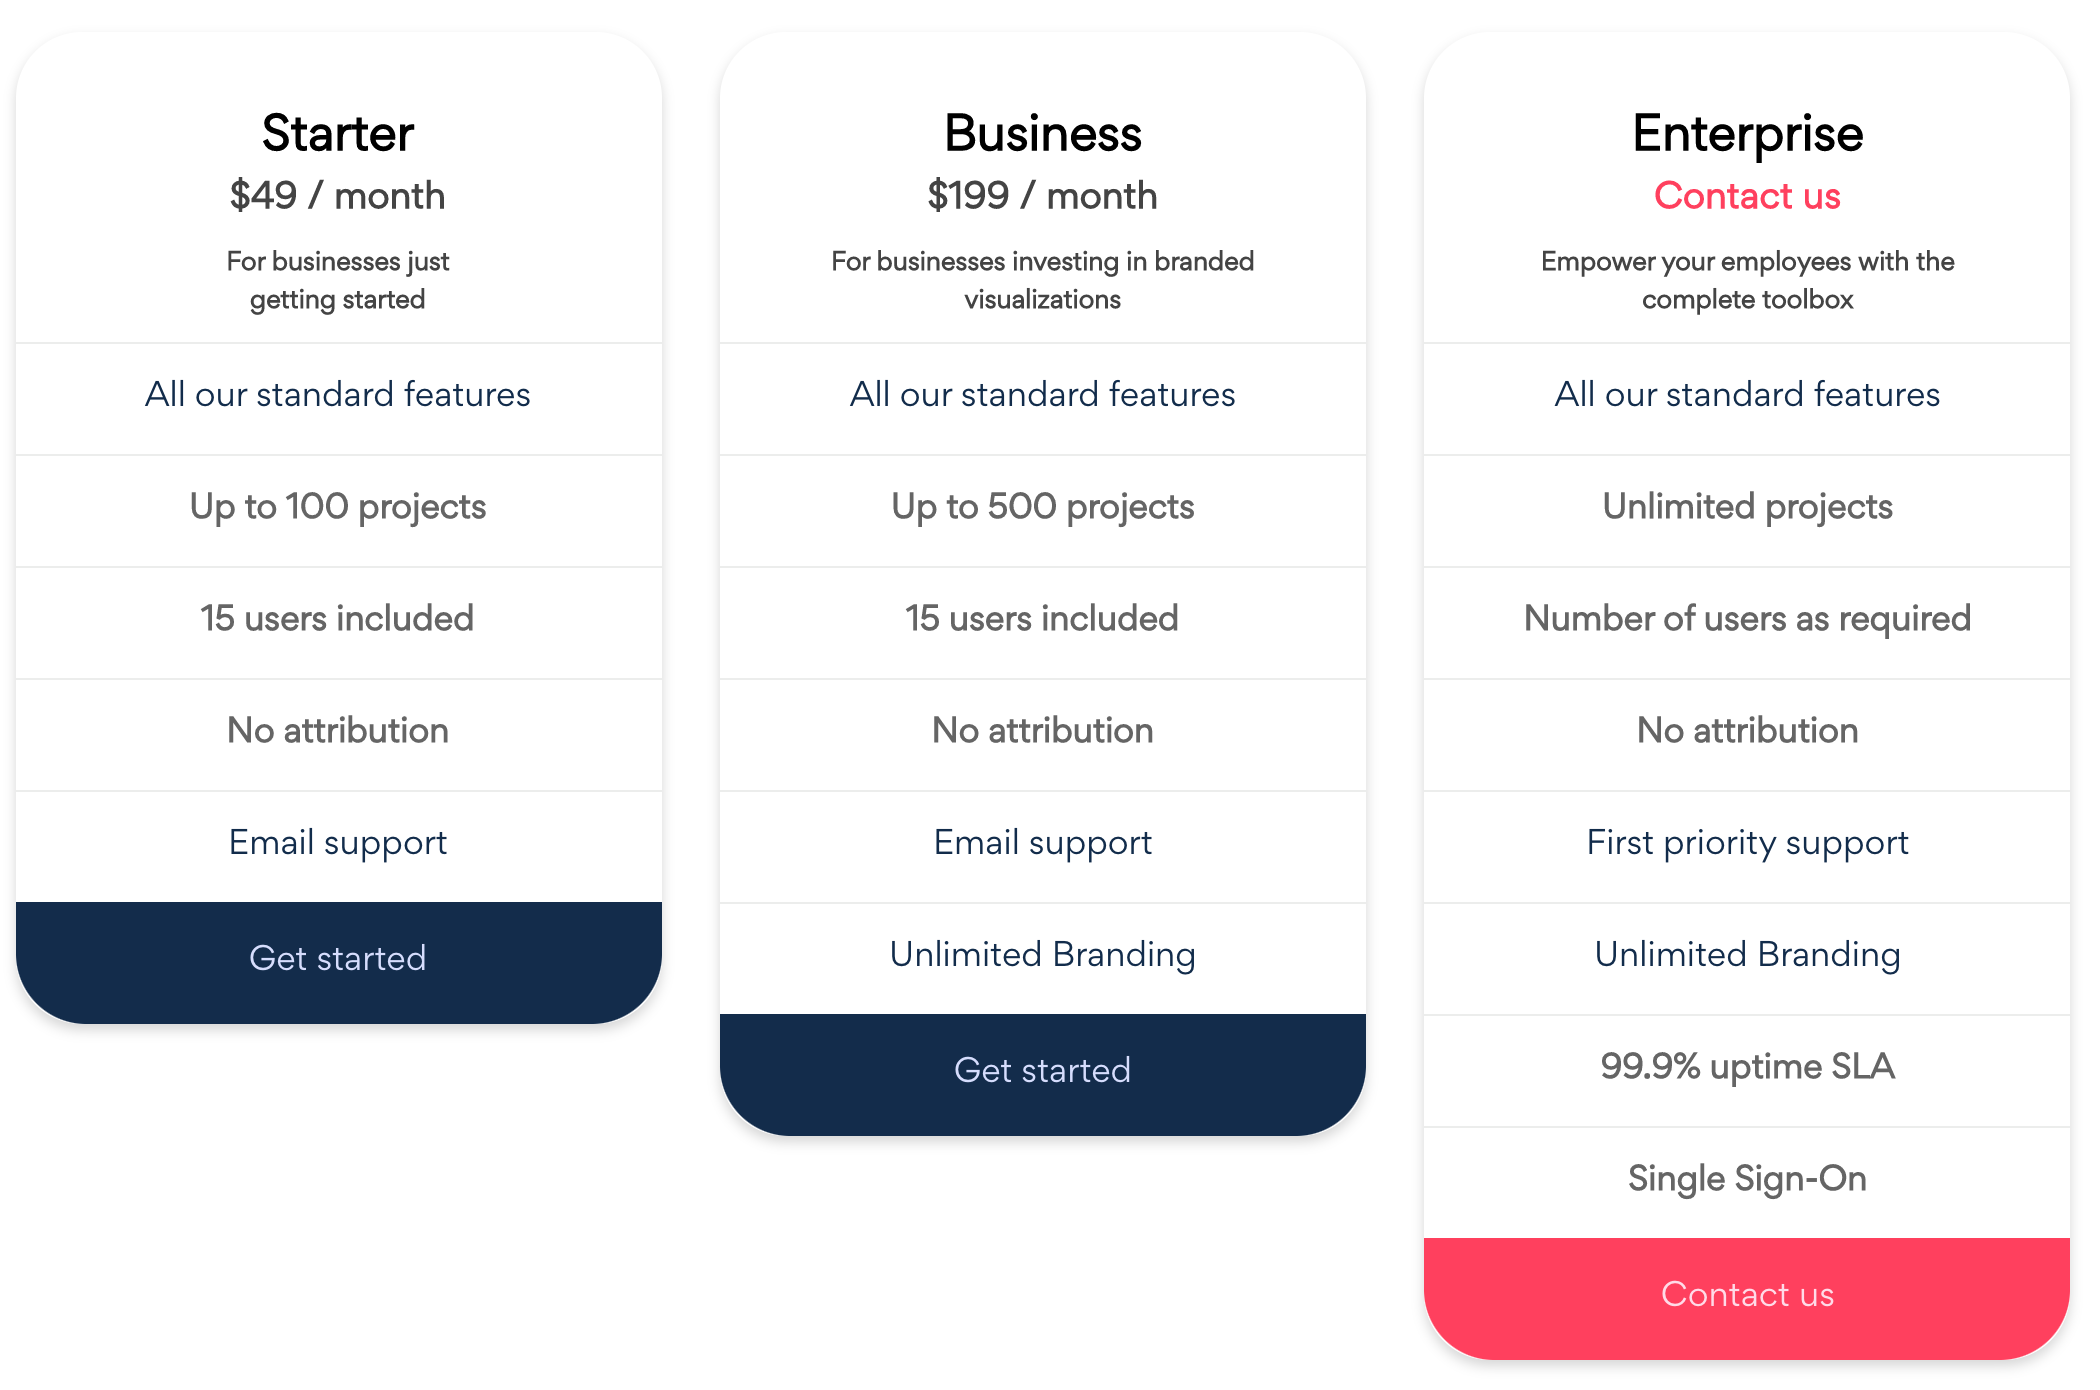
For the first time in 3 years, we are making an update to our pricing model. Based on feedback from customers, the price per-user model
Our customers keep society well informed, telling stories with data in an easy and understandable way. Our top requested feature in everviz has been to
If you are a researcher or academic, the growth of the internet has brought many opportunities for sharing your achievements with the world! However, journal
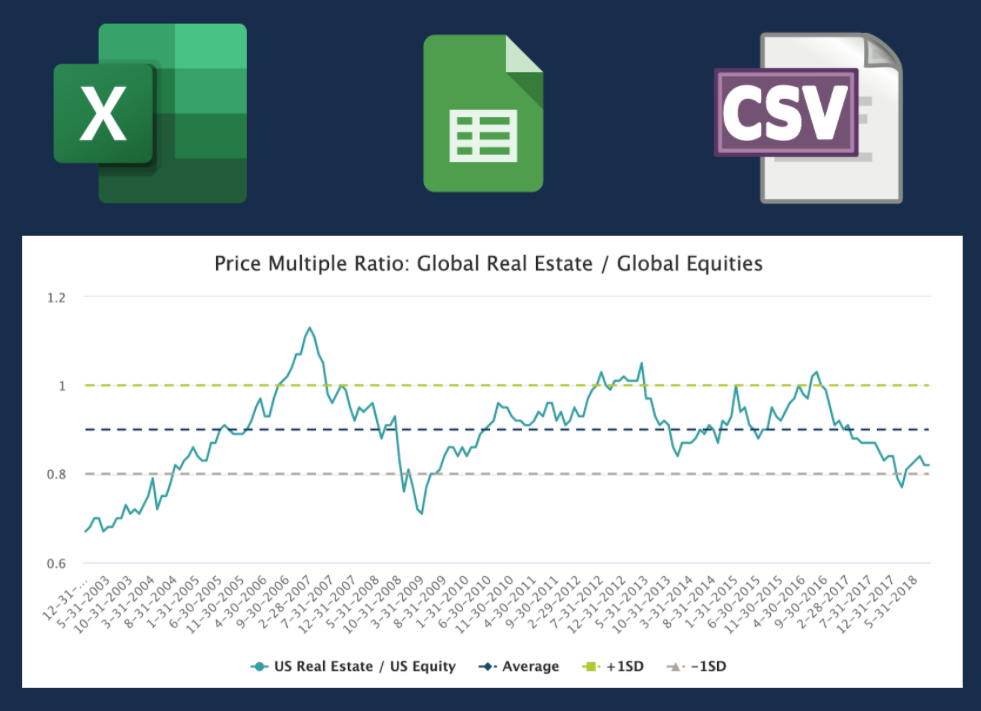
This post explains different ways you can get your data into everviz to bring your data to life through interactive diagrams The following options will
