Video as an increasingly popular medium for conveying information.
Our customers want to know – how do we make engaging videos with beautiful and relevant data graphics?
Our aim is to simplify the creation and sharing of captivating visualizations, empowering everyone to tell compelling stories effortlessly.
everviz streamlines chart generation, enabling you to enhance your content across various platforms, saving both time and resources.
Now with the added capability to download charts as video files, you can effortlessly repurpose your charts into your video projects. Bring your data to life with animated graphs, eliminating the need for specialized graphics skills in Adobe After Effects or Apple Motion graphics.
After you download your chart, graph or map from everviz, simply drag and drop them into the timeline of your preferred video editor, like Adobe Premiere, Apple Final Cut Pro, iMovie or similar.
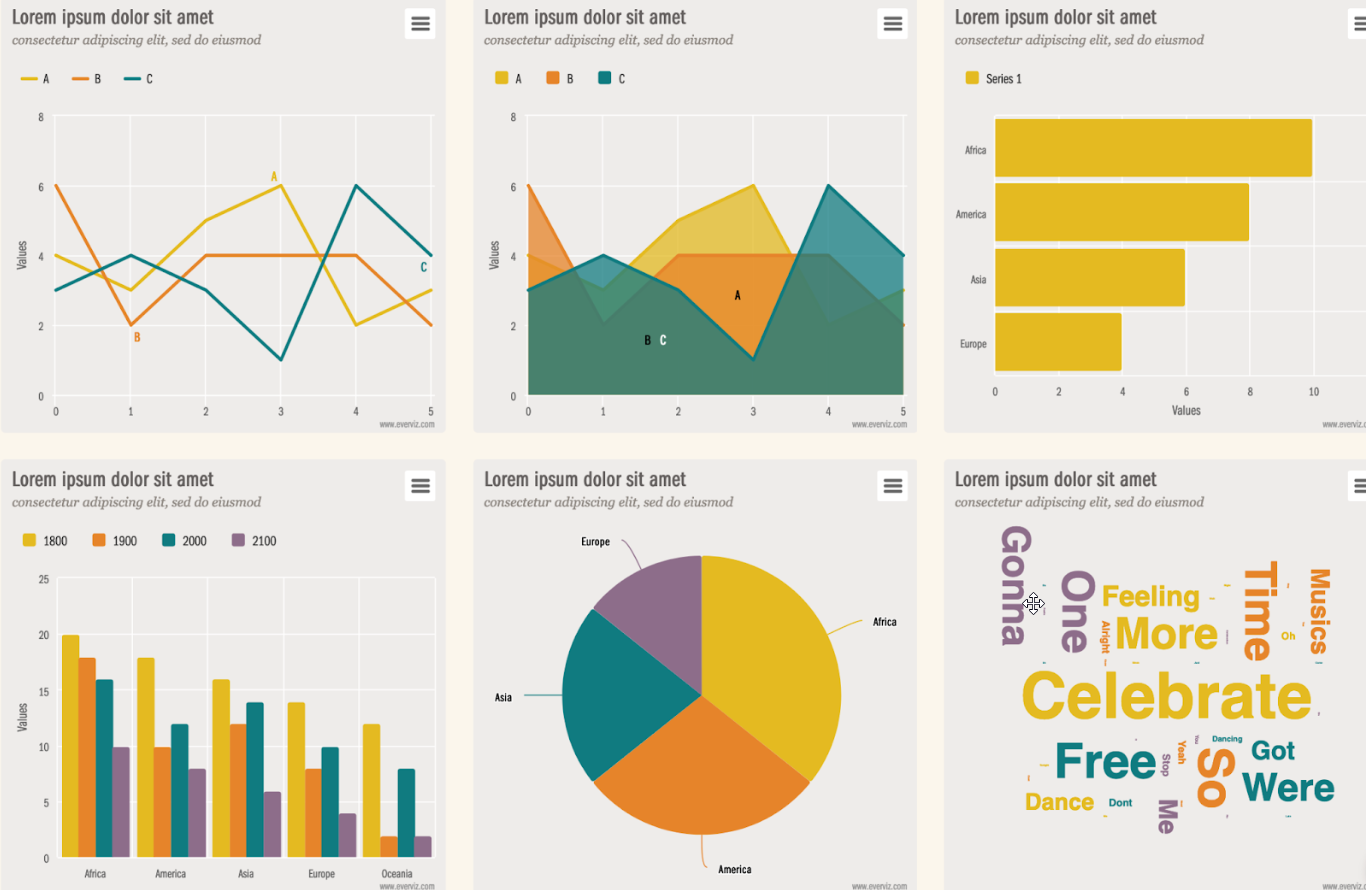
Here’s a video showing different examples of charts repurposed in video:
Let’s go through the process and demonstrate a few examples.
Creating the graph for your video
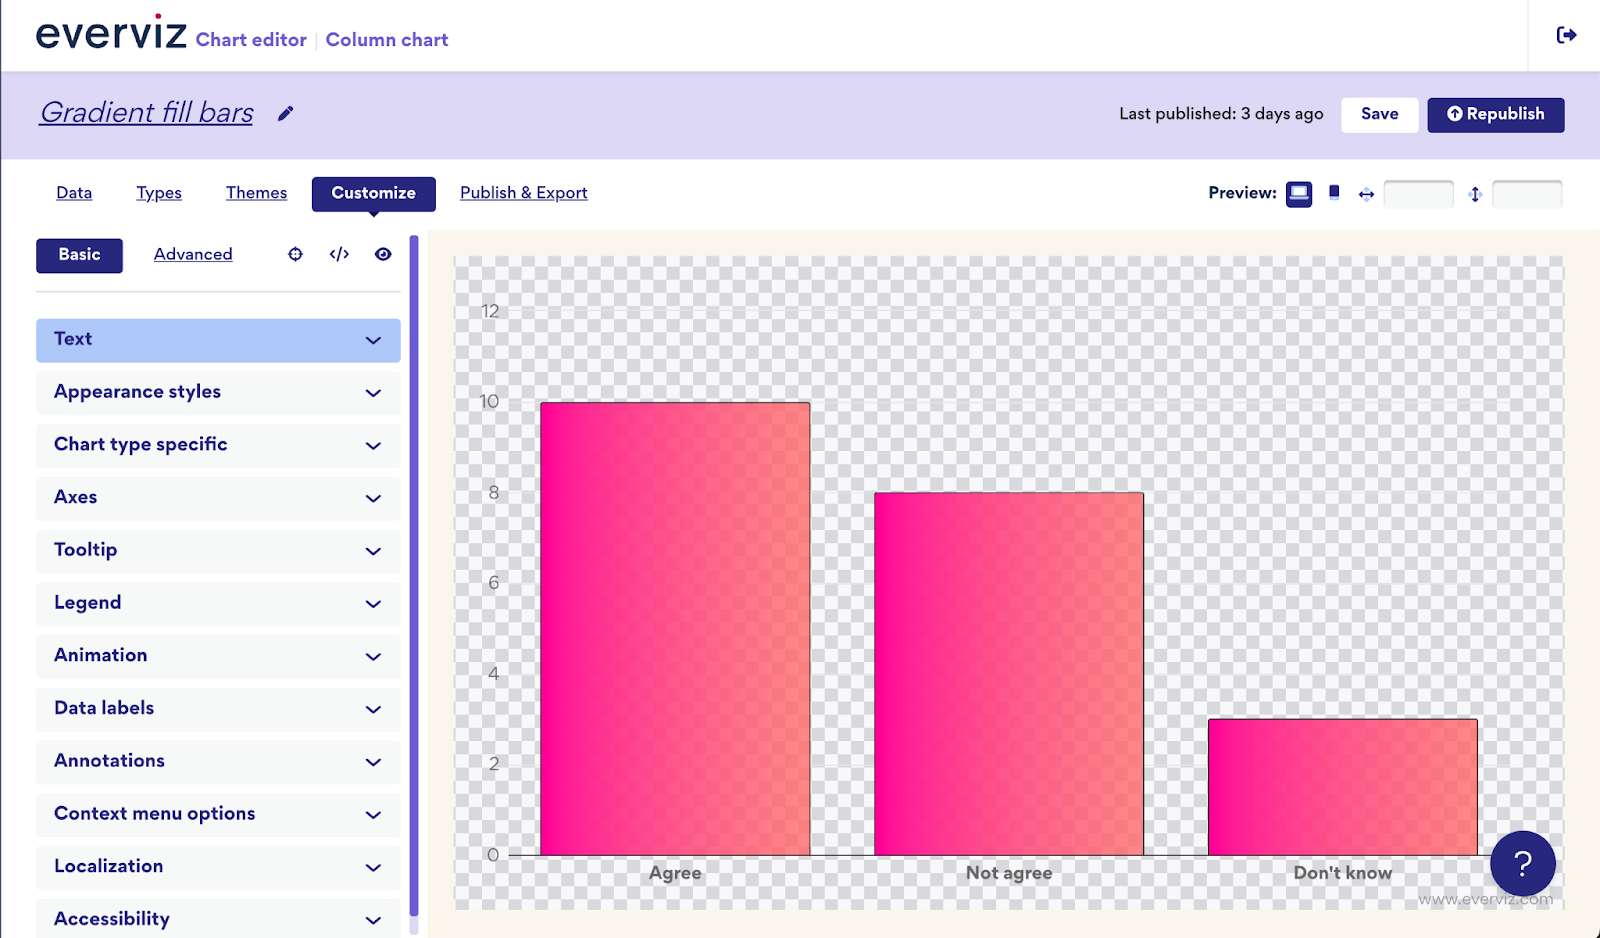
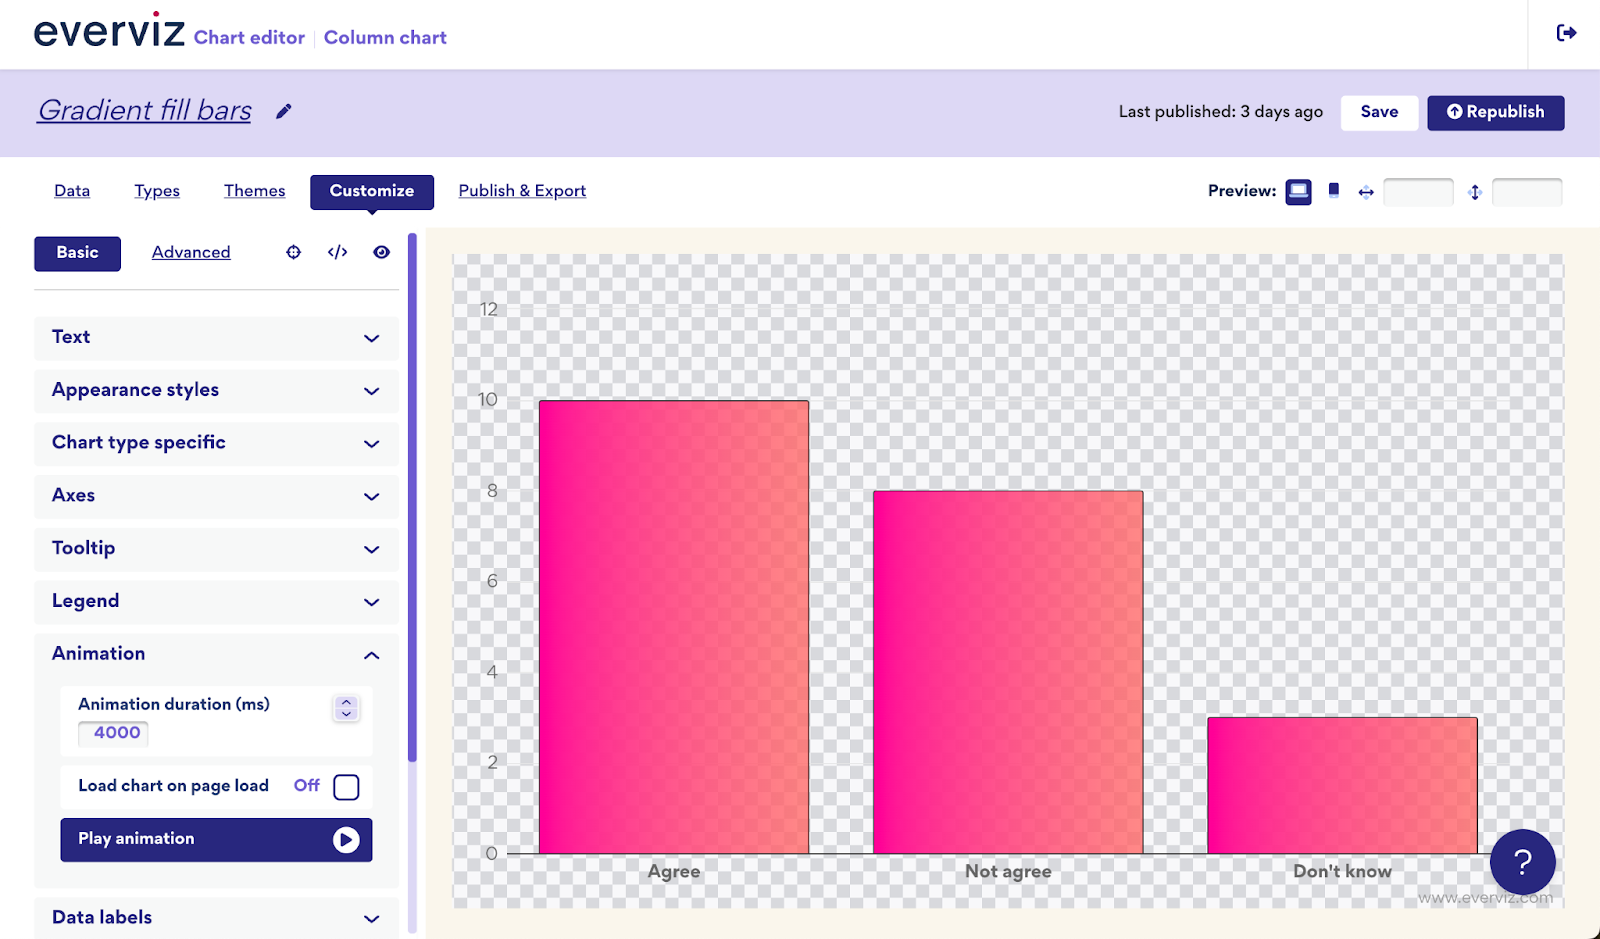
We’ve created a basic bar chart simulating responses from a survey:
You can recreate your own version of the chart by clicking here.
Customize
Navigate to the “Customize” tab and make sure the following settings are adjusted for optimal video export format:
- Appearance styles – Enable dynamic font = On.
- Appearance styles – Background = Set as transparent background
- Animation – Set your desired animation time in milliseconds
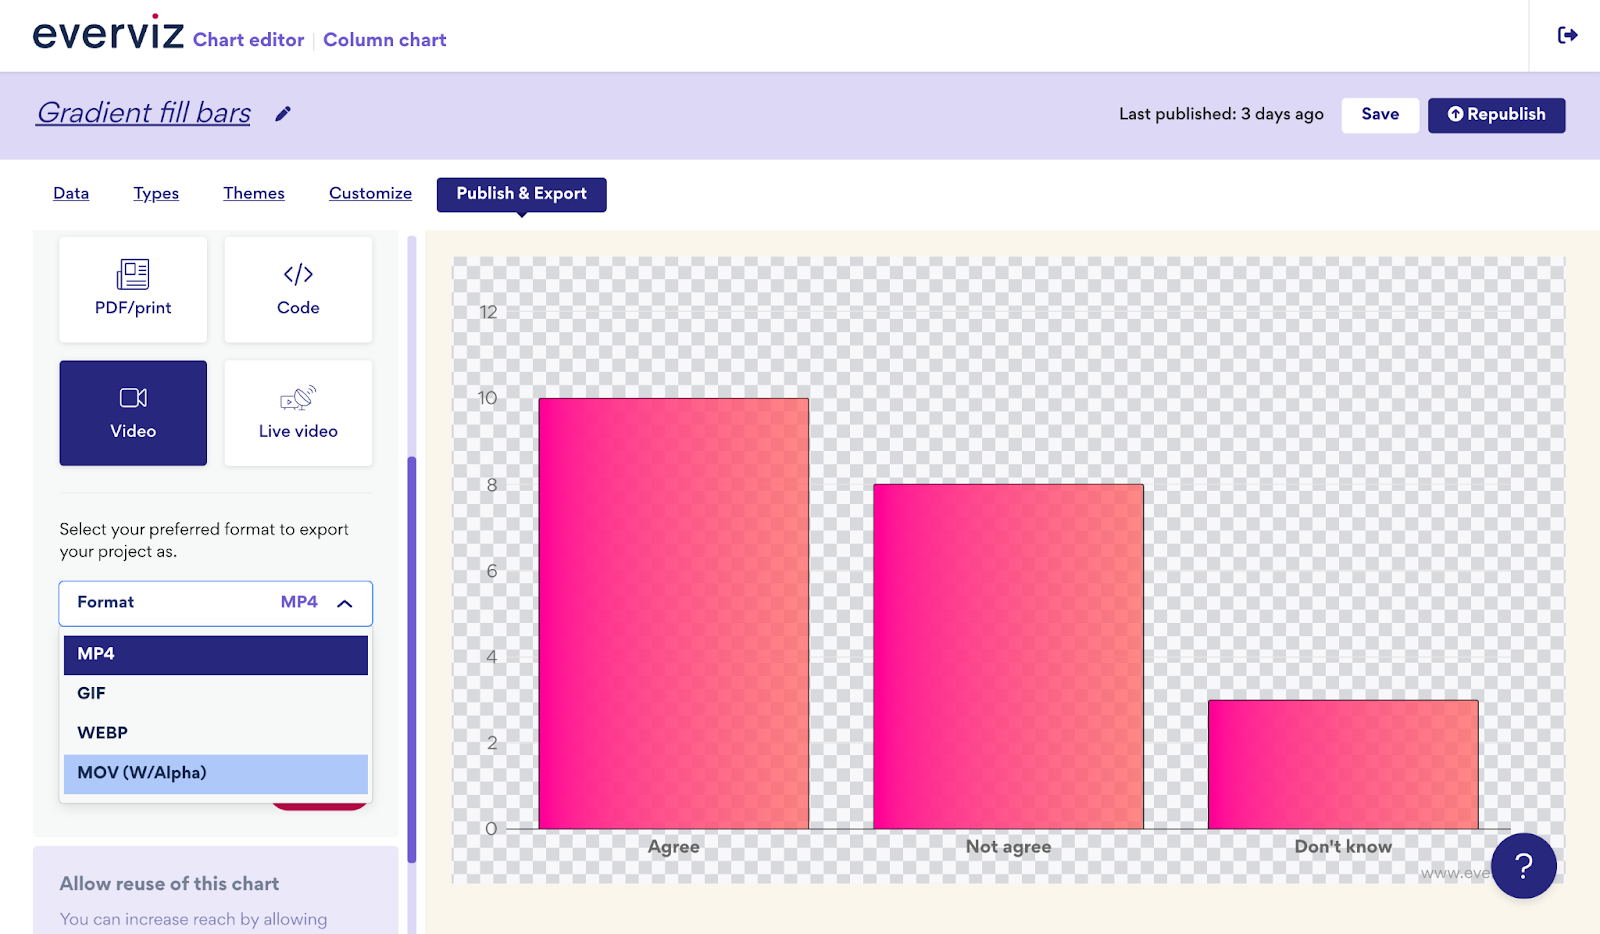
Export your chart to video
Go the the “Publish & Export” tab and click “Video”, here you can:
- Select your preferred format to export your project as. If you would like the video with transparent background, choose MOV (w/alpha). This will generate an Apple Prores 4444 file.
- Choose export width in pixels
- Choose export height in pixels
- Choose Frames Per Second (FPS)
- Click the “Export” button
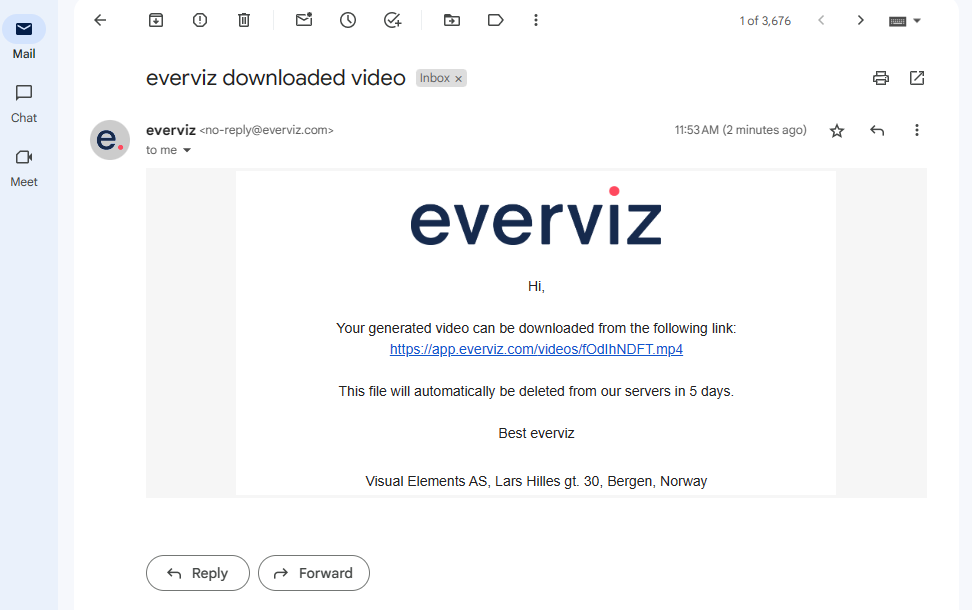
After clicking Export, everviz will process your request and generate the video. Shortly thereafter, you will receive an email with a download link for your video.
The file will be available for five days before we automatically delete it from our servers.
Import your chart to your video editor timeline
After downloading the video file you can drag it as an overlay video to your favorite video editing tool.
The following screenshots show how this could look in Final Cut Pro X and iMovie, but you could use Adobe Premiere or any other NLE of your choice.
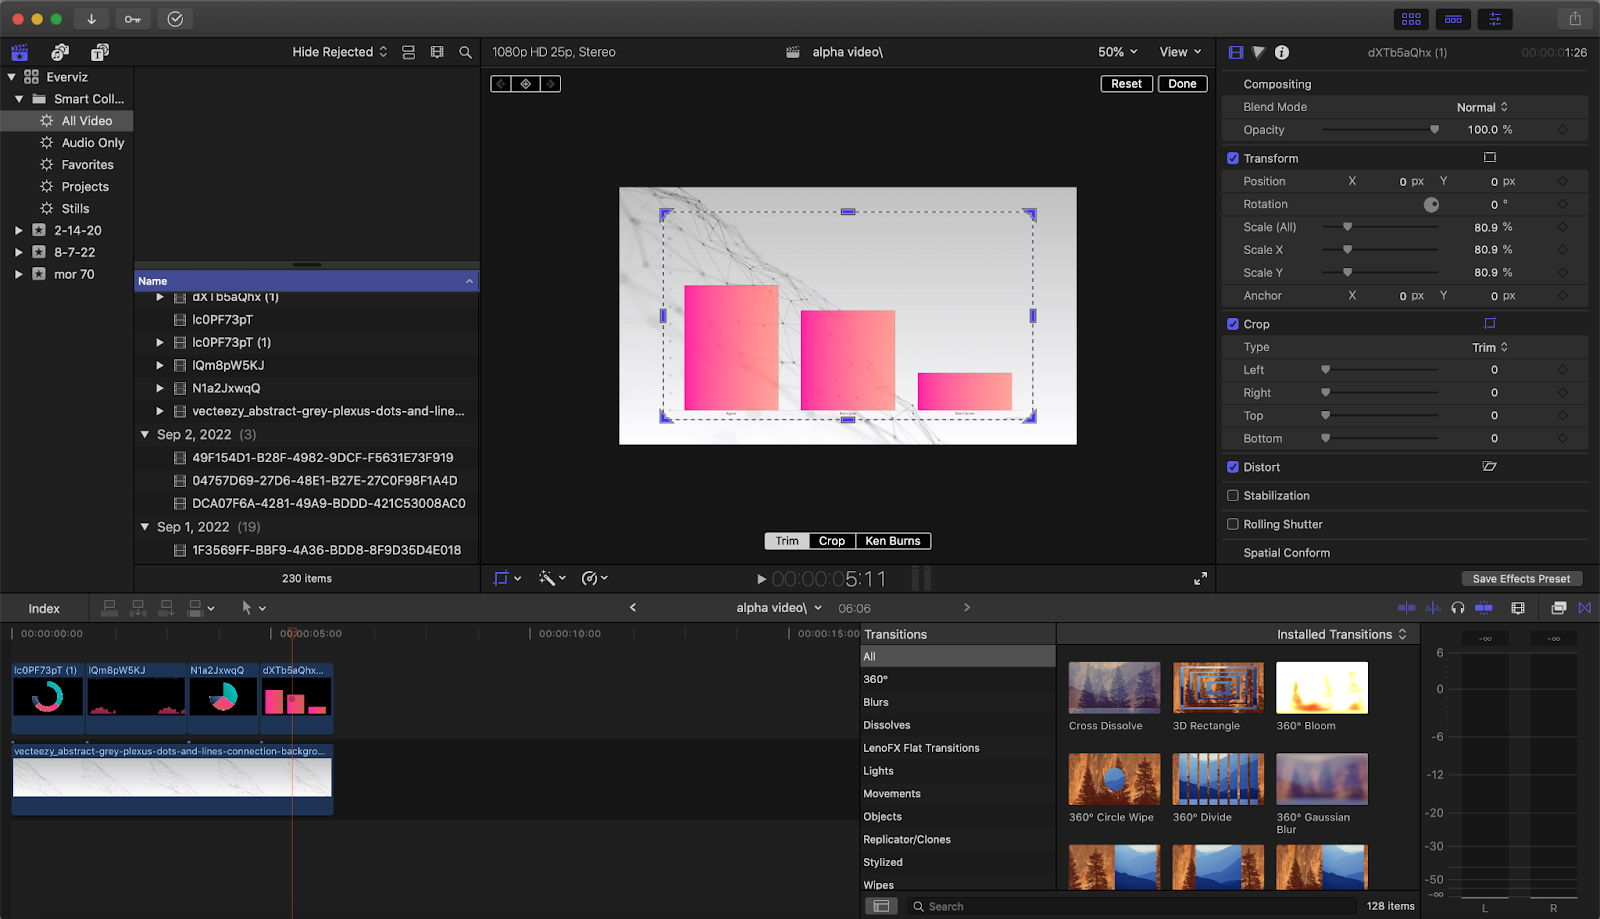
Final Cut Pro
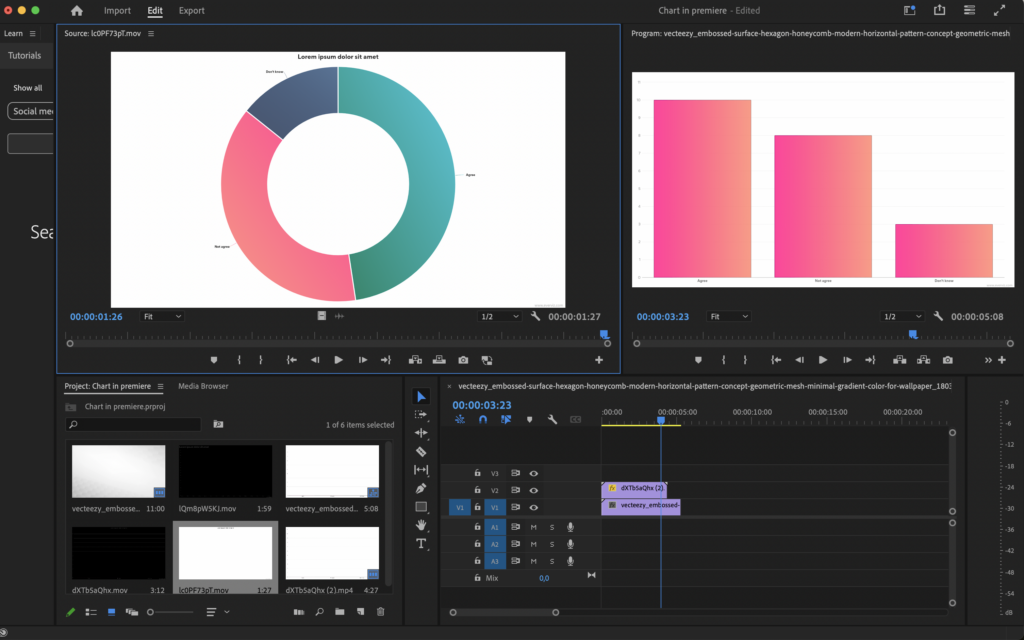
Adobe Premiere
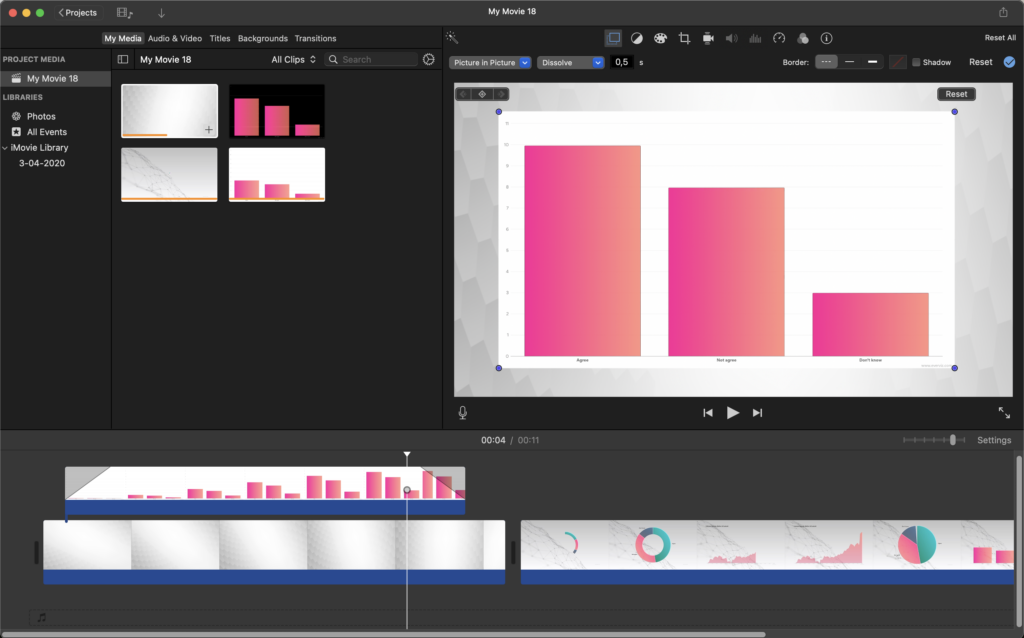
iMovie
Tips and tricks
When using charts in video, there are other considerations you should think about when designing for online.
Our recommendation is to build specific themes for your video files to speed up the customization process. Read more about themes in our knowledge base.
Font sizes and text contrasts
In a high quality video file, you probably want to increase the font sizes for titles, subtitles and other labels.
When you decide which background you want for your video you might also want to change text colors to give a high contrast.
See this document for how to change texts.
Animation time
You can control the length of the video file by setting the animation duration.
In the Editor, open the Animation Section.
Use the handle to select a duration time and hit the play button to preview.
Examples
You can find examples of charts in video on this page.
Video charts for news
Our media clients find charts in video particularly useful.
Popular online articles often are re-proposed in the evening newscast. If those articles contain charts, the charts are downloaded and inserted into a video package.
Multiplatform
Video is one of many exporting options in everviz. Exporting charts to different publishing points is part of our focus on multiplatform publishing.
This allows you to export the same chart to different platforms, while ensuring consistency in chart design and branding.
What do you think?
We want to hear from you – will you use charts in video? If so, how?