A guide to annotate your charts
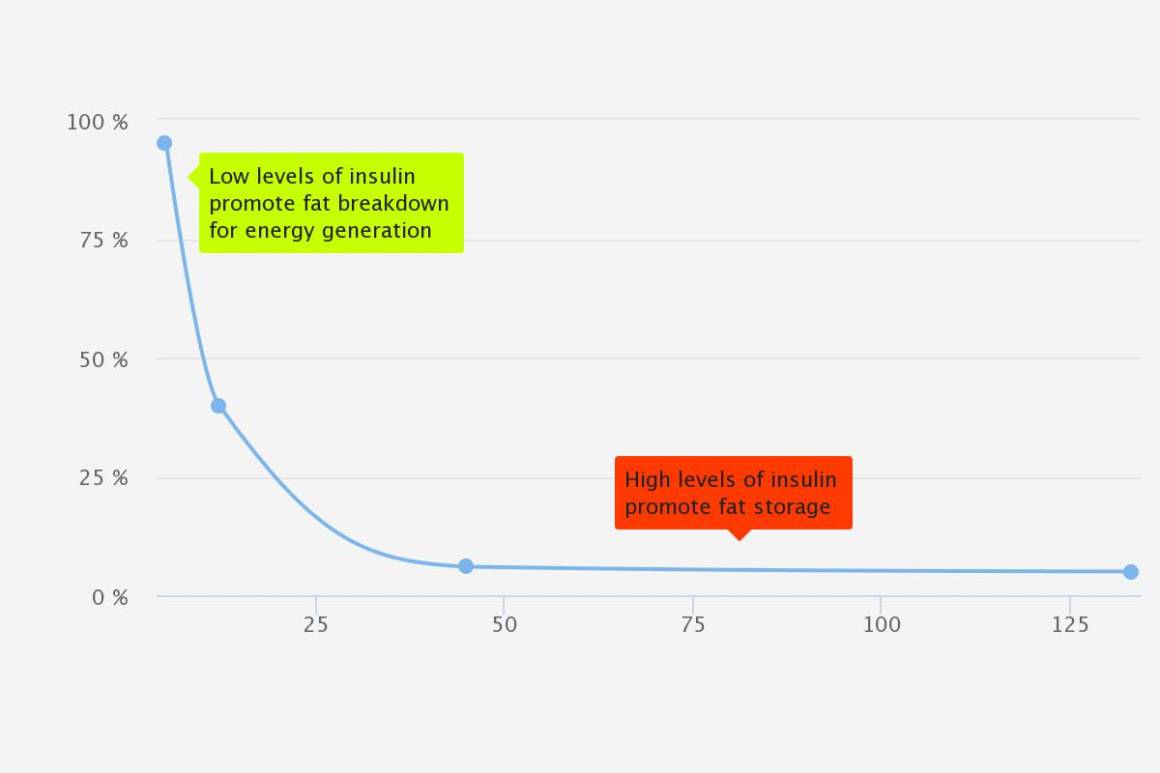
Sometimes a chart or map is not enough to clearly communicate the data on its own. Annotations can be helpful for showing when key events
Sometimes a chart or map is not enough to clearly communicate the data on its own. Annotations can be helpful for showing when key events

If you want to attract new readers, keep your online audience engaged, your content needs to be dynamic and interactive. Being that so much content
This post was originally published on the Highcharts blog, and was transferred as part of the rebrand from Highcharts Cloud to everviz. More than 3,000
This post was originally published on the Highcharts blog, and was transferred as part of the rebrand from Highcharts Cloud to everviz. Our brains process
At everviz, we want to help everyone easily visualize and communicate with data. That’s why we handpicked some of our favorite data visualization resources to
As a part of connecting and engaging with specific targeting groups within different sectors and industries, we have created a set of different info pages