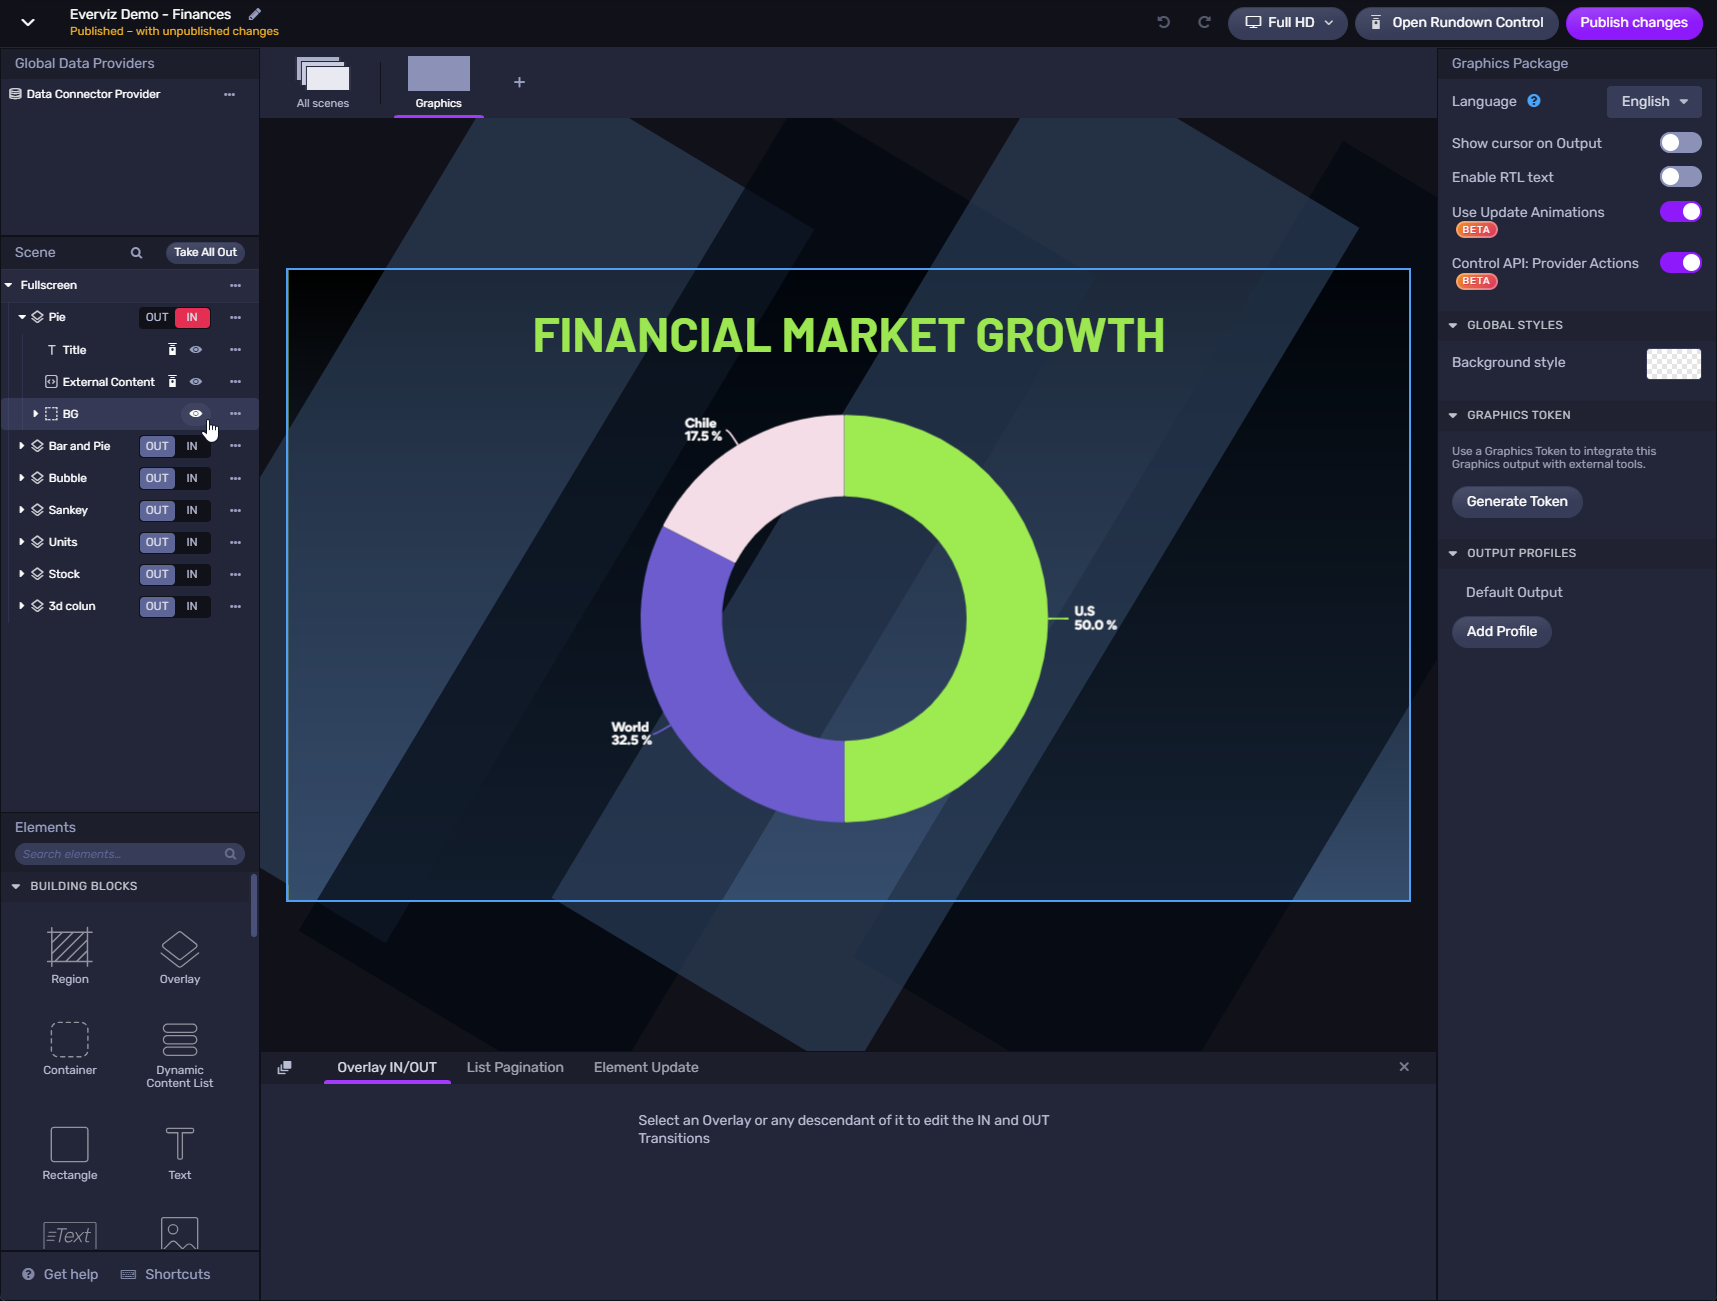
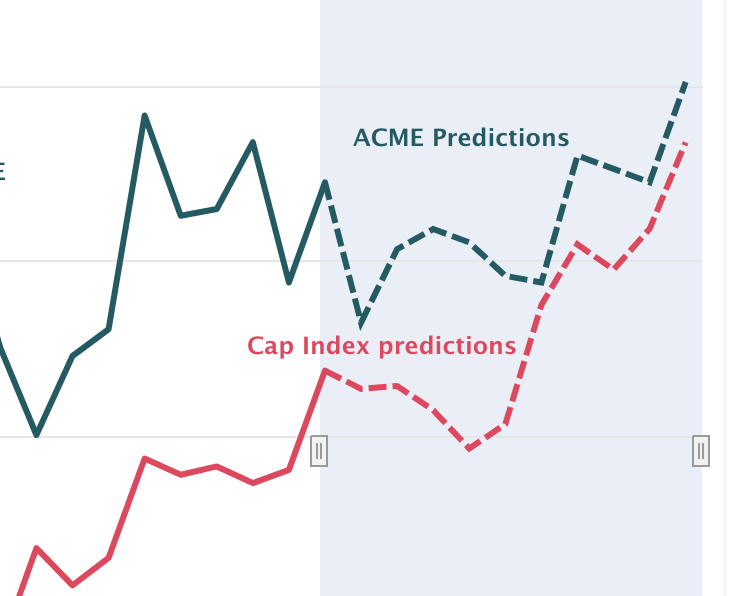
As a part of connecting and engaging with specific targeting groups within different sectors and industries, we have created a set of different info pages with example projects created in the everviz app. Here you can look and interact with live and relevant charts and maps, as well as book a short 15 min. free demo.
Visualizing Research Data
Other theme based pages related to charts, graphs and maps
- Area Chart Maker
- Area Graph Maker
- Bar Chart Maker
- Bar Graph Maker
- Chart Maker Online
- Chart Maker
- Make A Chart Online
- Column Chart Maker
- Column Graph Maker
- Online Graph Maker
- Make A Graph Online
- Graph Maker
- Line Graph Creator
- Line Graph Maker
- Make A Map
- Map Maker Online
- Create A Pie Chart
- Make A Pie Chart
- Pie Chart Creator
- Pie Chart Generator
- Pie Chart Maker
- Pie Graph Maker
- Make A Scratter Plot
- Make A Candle Stick Chart
- Make A Scratter Plot
- Choropleth Maps Maker


