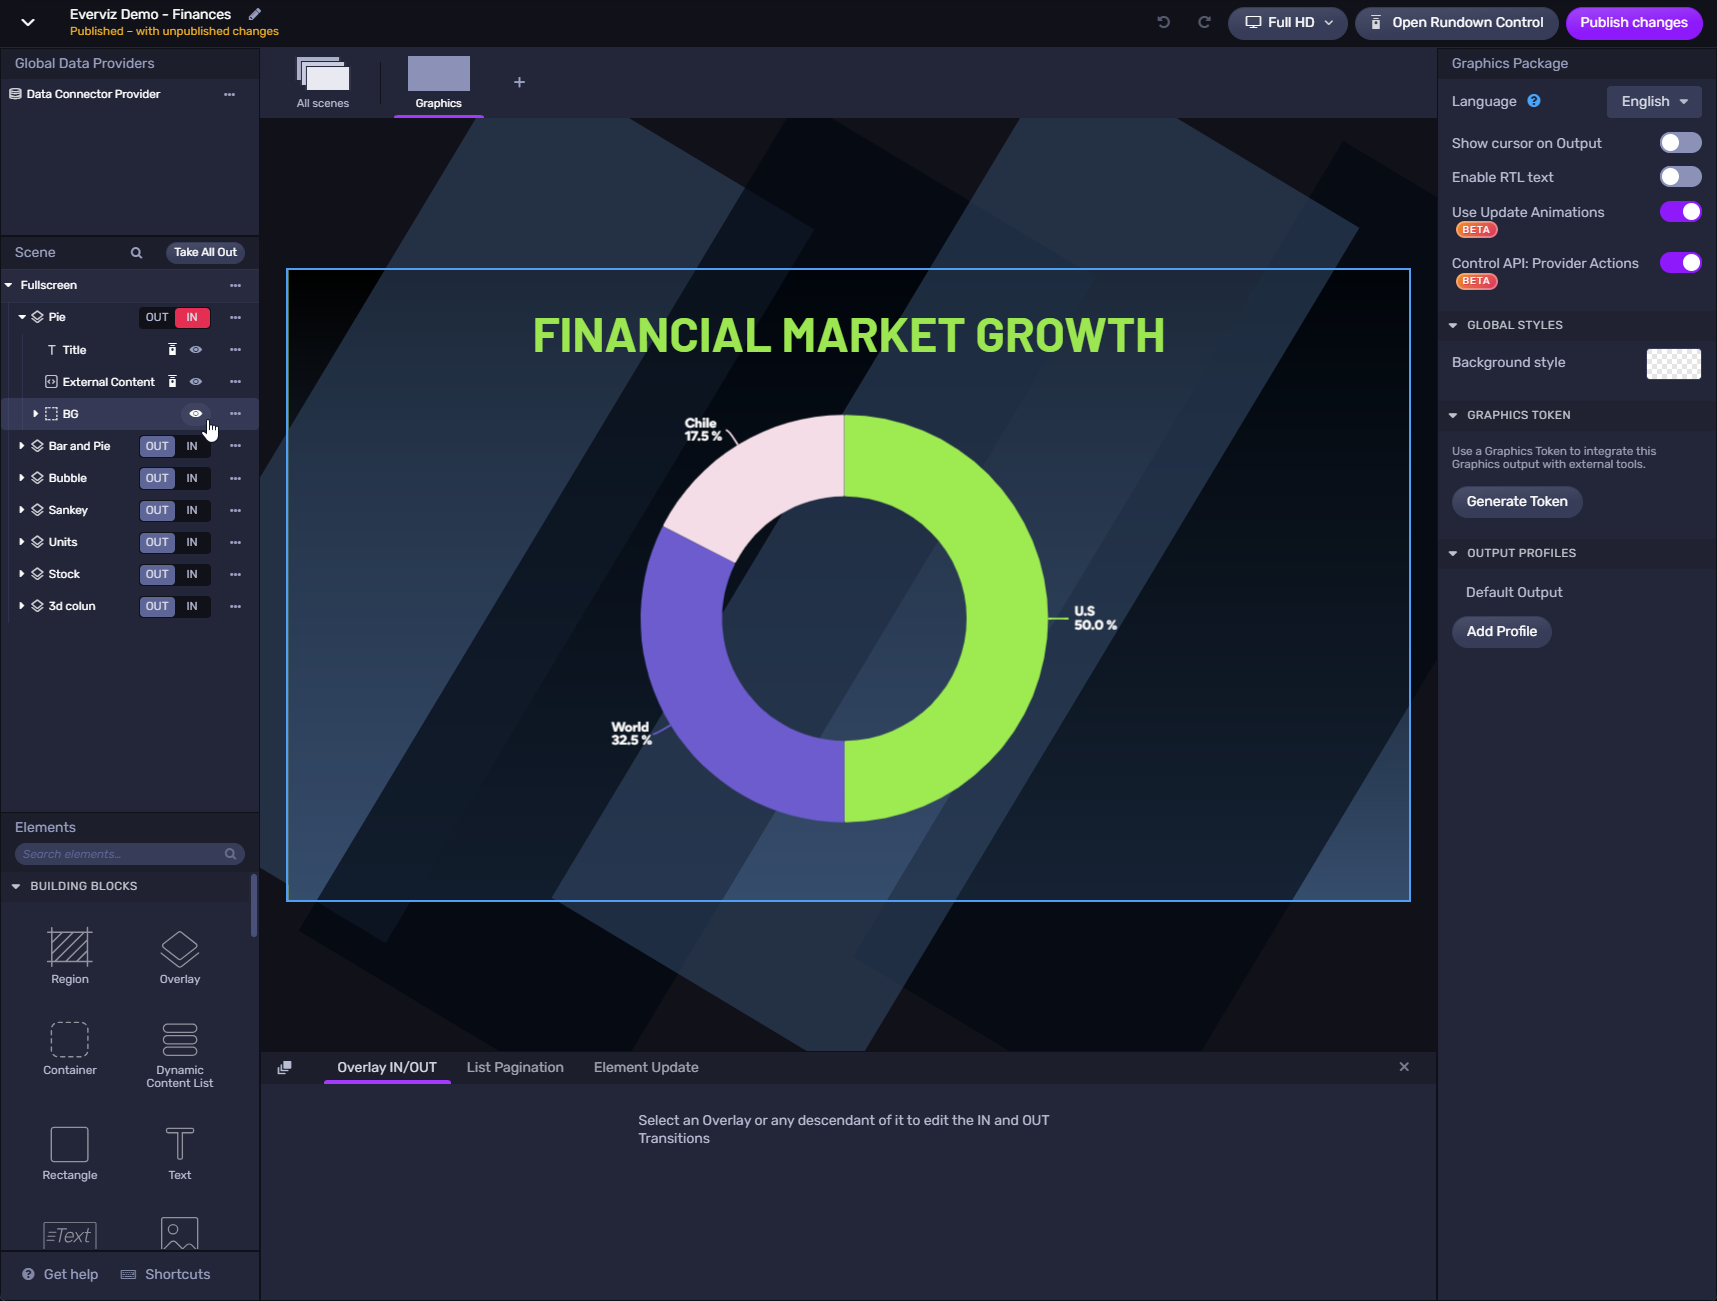
New publishing panel supporting multiplatform data visualizations
📺everviz charts can now be seamlessly inserted into live video – making multiplatform data visualizations possible. Until now, making charts for live video required specialist
📺everviz charts can now be seamlessly inserted into live video – making multiplatform data visualizations possible. Until now, making charts for live video required specialist

We are pleased to welcome Amy Cesal to the team as our Product Evangelist. Amy will liaise with our chart designers to create charts and
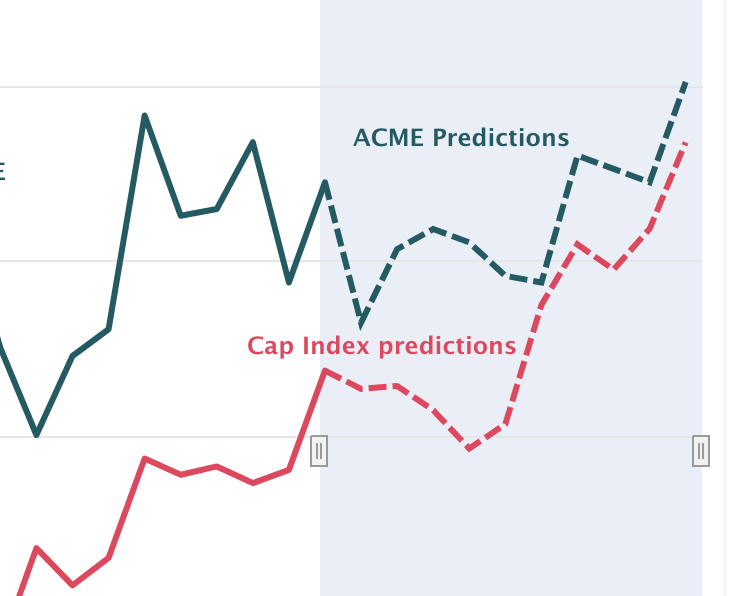
Reference Lines, Plot Bands, arrows, ranges or goal lines! These are just a few ways you can Highlight your data to help your audience better
We are the developer of everviz, a visualization tool made for helping journalists and Content Creators to tell complex stories in a simple way. Our
As a part of connecting and engaging with specific targeting groups within different sectors and industries, we have created a set of different info pages
