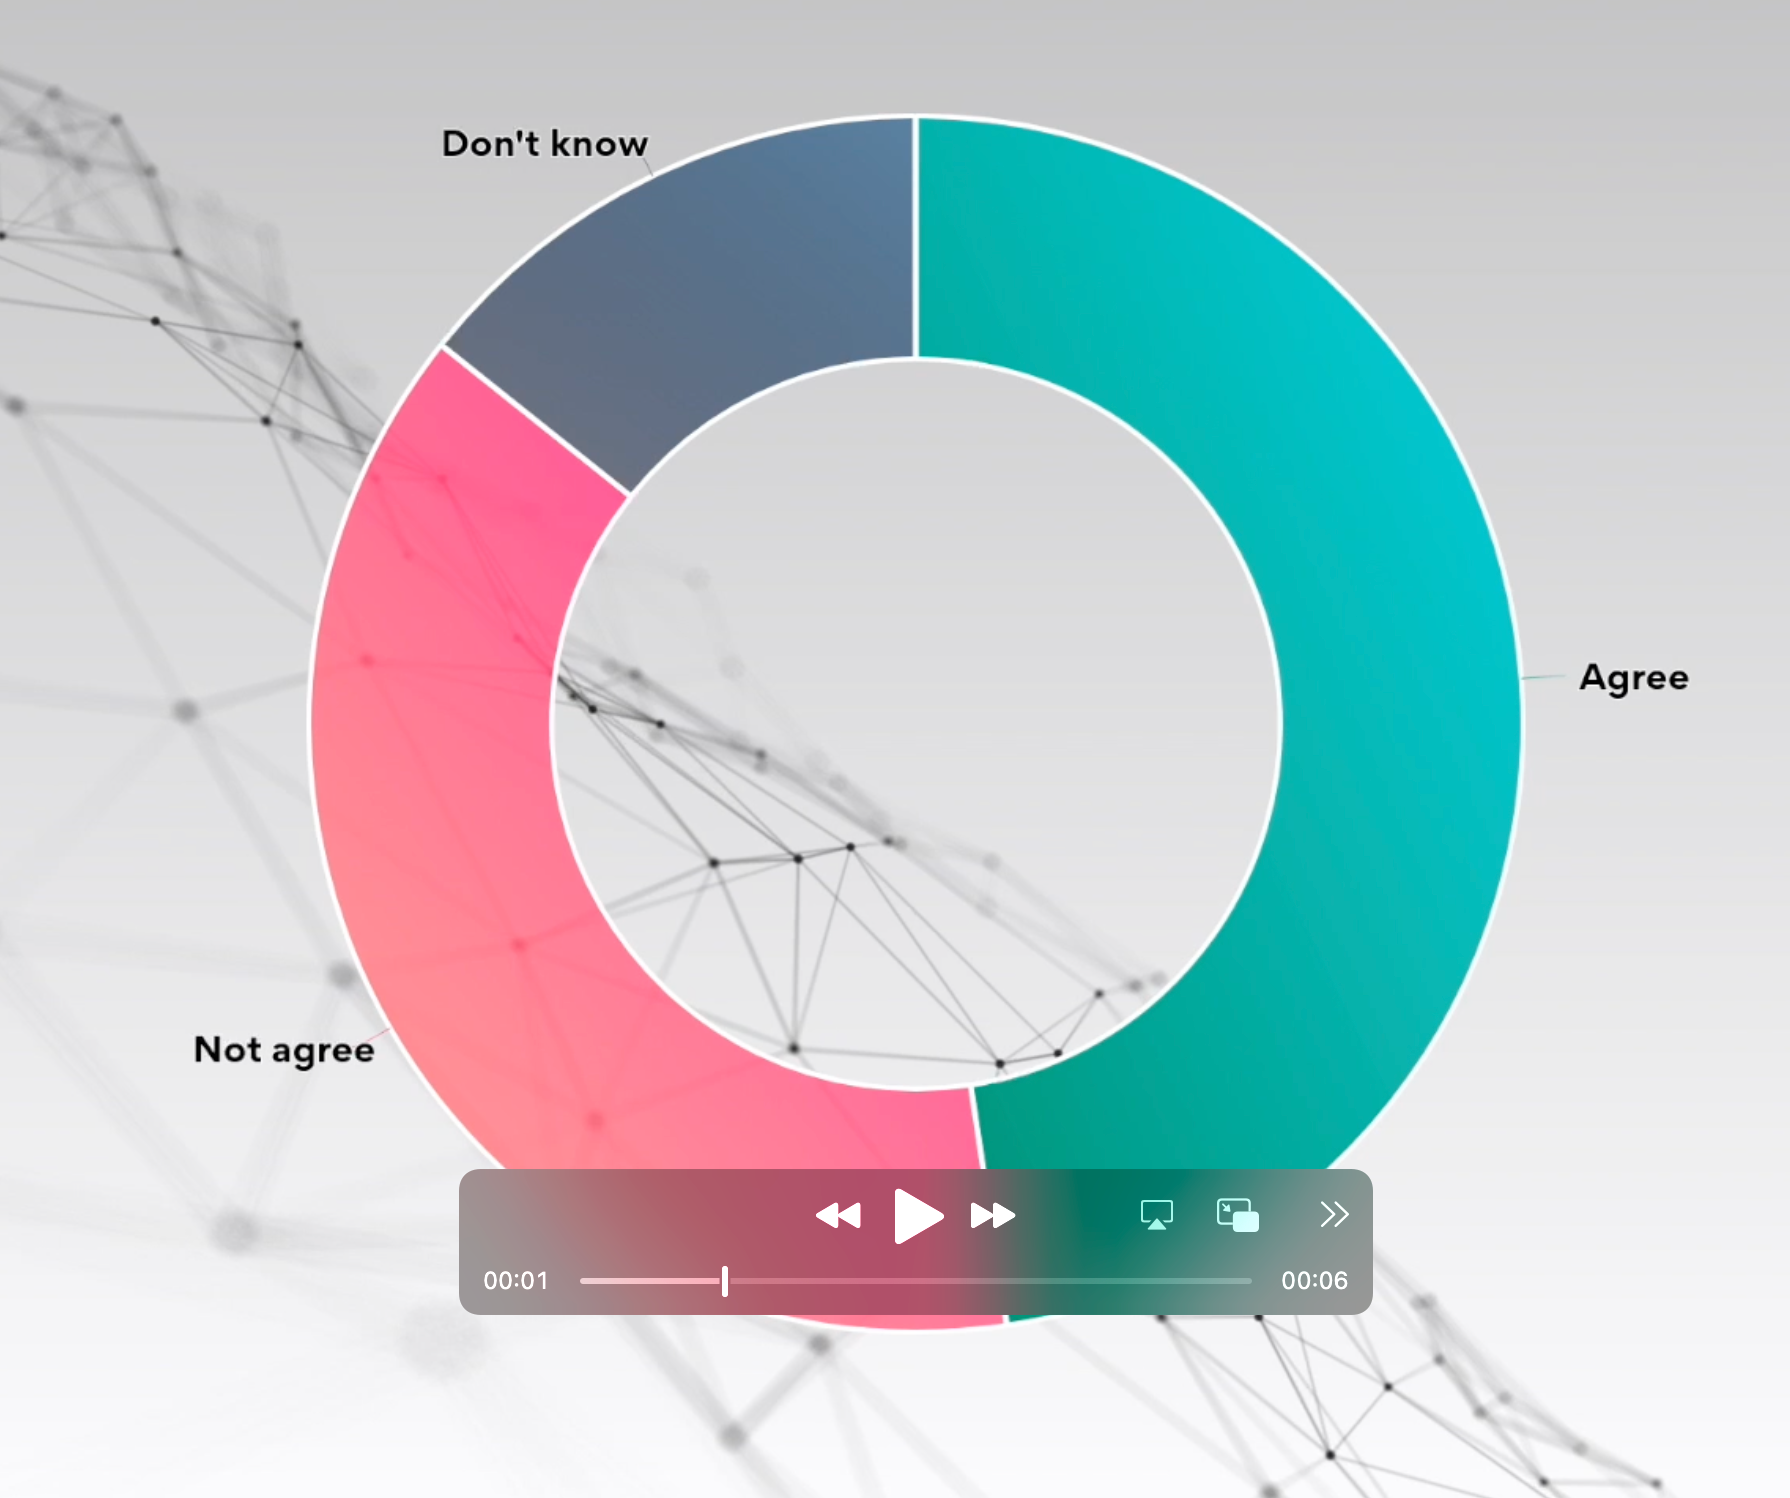
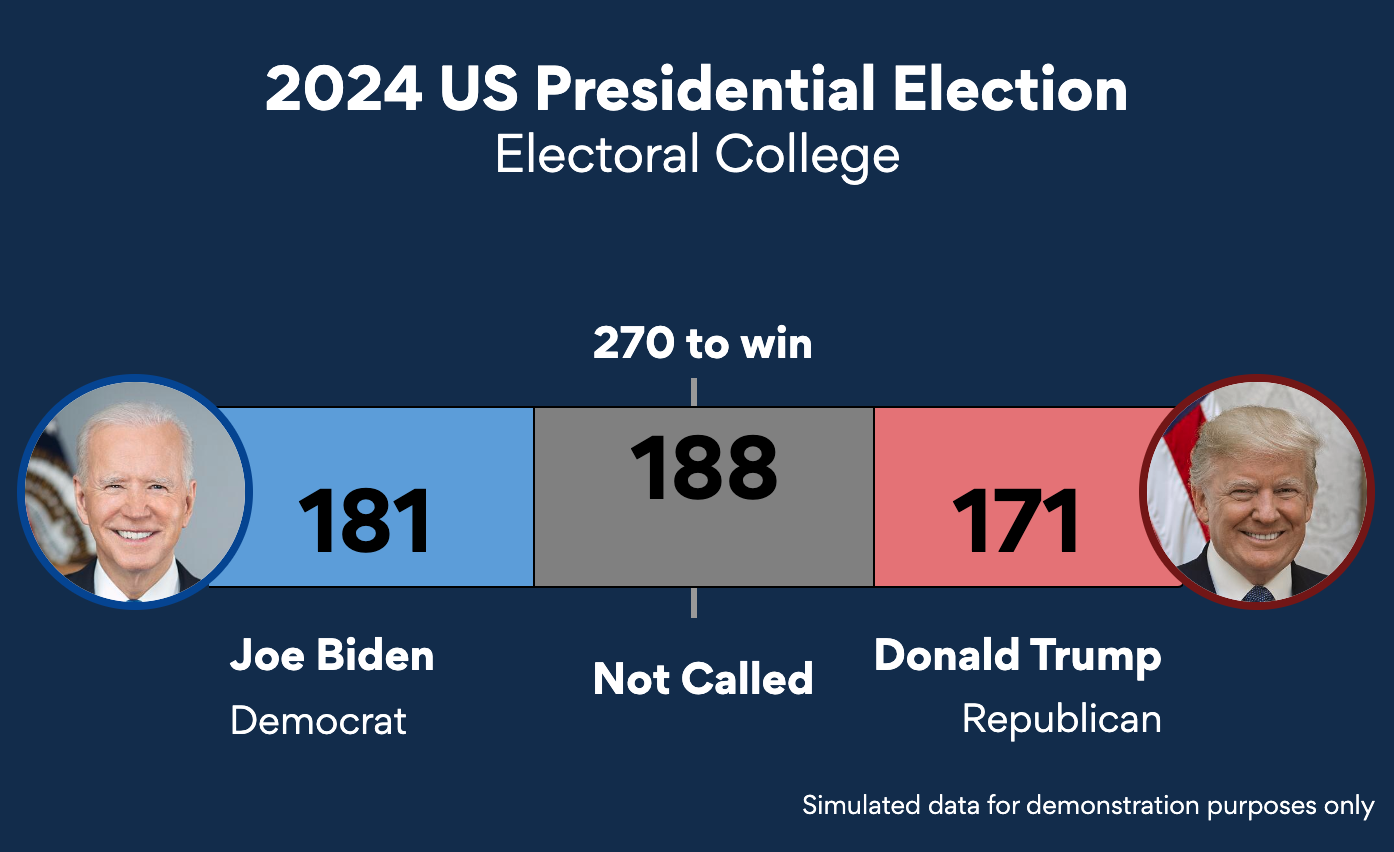
We are thrilled to share some exciting news that is set to transform the landscape of live TV broadcasts: everviz has integrated seamlessly with Viz Flowics, and the possibilities are related to TV visualizations boundless.
In today’s fast-paced media environment, staying ahead of the curve is essential. Data-driven storytelling has become key to modern journalism, especially when it comes to covering events like elections, financial market updates or sports competitions. Until now, however, bringing data to life in real-time broadcasts was a complex, time-consuming task, requiring specialized designers and software.
That’s where our integration comes into play.
Bridging the gap between data and broadcast graphics
Viz Flowics is a powerful tool for creating HTML-based TV graphics. It’s widely used in the industry for crafting engaging visuals that captivate audiences. everviz, on the other hand, is renowned for its simplicity in generating stunning data visualizations, including charts and maps.
Now, the two worlds have collided.
Our integration allows you to effortlessly embed everviz charts and maps directly into your Flowics graphics templates. This means that the beautiful, data-rich visuals created with everviz can seamlessly become a part of your live TV broadcasts. No more waiting for a specialist designer to craft these visuals. With everviz, anyone on your editorial team can easily create them.
Empowering broadcasters
This partnership empowers broadcasters to take their data-driven storytelling to new heights. Imagine covering an election night, providing real-time financial updates or showcasing sports statistics with animated, visually-stunning charts seamlessly integrated into your broadcast graphics.
At Vizrt, we’re committed to providing content creators with the tools they need to create captivating graphics. Our partnership with everviz is an exciting step towards enhancing the visual storytelling experience. The seamless integration of everviz charts and maps into Viz Flowics graphics offers broadcasters a powerful new way to engage and inform their audiences,” says Gabriel Baños, Flowics CEO & Co-Founder.
The benefits are clear:
- Enhanced engagement: Interactive data visualizations capture viewer attention and keep them engaged with your content
- Deepened understanding: Complex data becomes accessible and understandable, making your broadcasts informative and insightful
- Efficiency: Say goodbye to the time-consuming process of manually designing data visuals for broadcasts. Now, it’s as simple as a few clicks
How it works
Using the everviz and Viz Flowics integration is a breeze. Your Flowics operator creates a template for your graphics, and you can effortlessly insert everviz charts and maps into this template using our integration.
Stay tuned for detailed tutorials and resources on how to make the most of this integration on the everviz blog and knowledge base.
Join us on this exciting journey
“This integration marks a significant milestone in our journey to democratize data visualization. We believe that data-driven storytelling should be accessible to all. By joining forces with Viz Flowics, we’re making it easier than ever for broadcasters to bring their data to life in real-time broadcasts,” says Håvard Tveit, CEO of everviz.
We invite you to join us on this exciting journey of data-driven storytelling in live broadcasts. Try out the integration, explore the possibilities and share your feedback with us. Together, we can reshape the future of broadcasting.
If you have any questions or need assistance, don’t hesitate to reach out to us using the form below.
Let’s elevate your broadcasts to new heights with everviz and Viz Flowics.


