This post was originally published on the Highcharts blog, and was transferred as part of the rebrand from Highcharts Cloud to everviz.
Have you ever found yourself with too little real-estate in your app, dashboard, or article to comfortably display all the charts you want to show?
Then, implementing a drop-down list for displaying the charts one-by-one, may be an option.
In this article, I will walk you through the steps for building a drop-down list, that displays charts one by one.
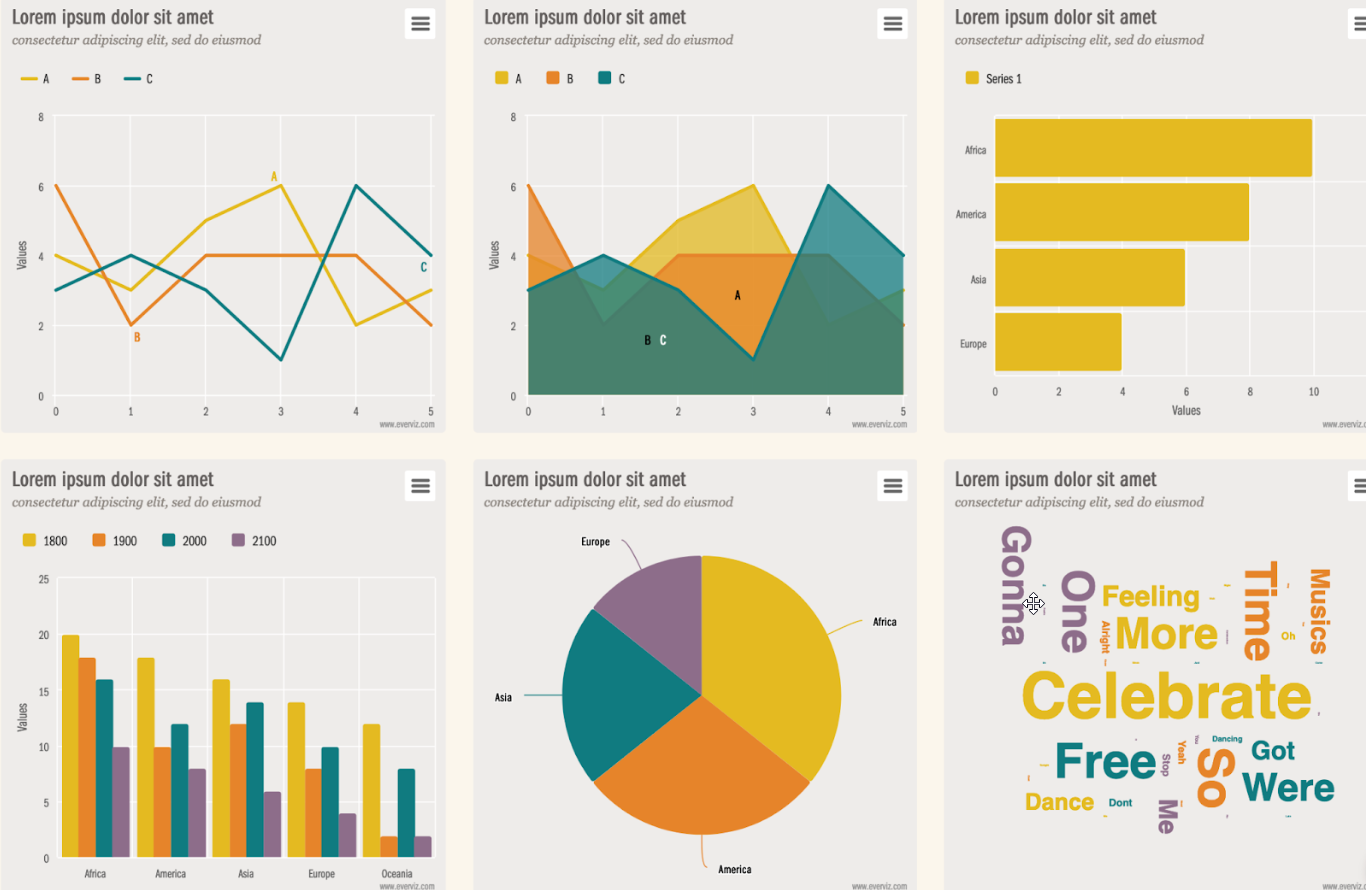
This article won’t focus so much on creating the charts, but instead, we use pre-made charts from my charting collection on everviz.
everviz is an online service individuals or teams to creating charts using a powerful WYSIWYG editor (i.e. no coding). It’s a great tool for giving employees the ability to publish content with charts, without relying on a team of developers or designers. Watch this video for getting an impression of creating charts with everviz.
Outline of what I want to build
For the purpose of this article, I created three charts.
- https://app.everviz.com/show/ByFBJHnyQ
- https://app.everviz.com/show/rJr1gB3Jm
- https://app.everviz.com/show/r16tyUhyX
These charts will be added to my webpage, having each chart in its own enclosing <div> element. The div elements are initially hidden with the display:none CSS property. Listening to the onchange event of the dropdown list, will display the corresponding chart and hide all other charts. See the below wireframe to get an idea of how it should look like.

Apart from the design of the widget, I need to build the following functionality:
- Load the charts by JavaScript injection.
- Loading the charts is an async process that needs to be monitored.
- When all charts are loaded, extract the chart titles for populating the dropdown list.
- The
onchangeevent of the dropdown list that unhides the selected chart and hides the previous chart.
About chart injection
Let me explain first about adding charts by JavaScript injection. You need to understand the internals of it before we start coding.
everviz offers two options for adding your chart to a webpage with copy/paste of HTML snippets. You can embed by <iframe>, or instead use the snippet for JavaScript injection. See here below the Publish dialogue from the everviz charting editor.

The above dialogue creates the following HTML snippets for embedding a chart:
- publish with an iframe
<iframe class="highcharts-iframe" src="https://app.everviz.com/embed/zh90QUuF5/" style="border: 0; width: 100%; height: 500px"></iframe>- publish by injection.
<div id="highcharts-zh90QUuF5">
  <script src="https://app.everviz.com/inject/zh90QUuF5/" defer="defer"></script>
</div>
An iframe securely displays content from other domains and resolves cross-domain issues, but can be challenging to use in a responsive page. Sure, you can make the iframe’s width 100%, but it’s difficult to size the height as it depends on the iframe’s content. As a result, the iframe’s content can easily overflow.
Instead of using an iframe, adding charts by JavaScript injection, creates the chart in your webpage physically and gives you, therefore, more control over responsive styling of the page’s elements. Please note that JavaScript injection makes you susceptible to XSS attacks, so use at least the HTTPS protocol for loading scripts.
The inject script
Loading the https://app.everviz.com/inject/zh90QUuF5/ injection script from the above code example will do the following;
- Checks if all libraries are loaded,
- and then creates the chart and renders it to the
<div id="highcharts-zh90QUuF5">
In this article, we rely on Javascript injection for adding the three charts to the webpage.
Let’s get started coding!
I will explain with code snippets how I build the widget. The full code you can find here in the highcharts-cloud-selector repository on GitHub. Find a working demo here on Glitch to remix and play with the code!
Load the charts by injection.
First I created an array of the three unique chart hashes that identify each chart on Highcharts Cloud. This makes the widget easy to expand when I need to add another chart. Then I only have to modify the array named hashArr and leave the rest of the script intact.
// Place here your chart hashes
  let hashArr = ['ByFBJHnyQ', 'rJr1gB3Jm', 'r16tyUhyX'];

// create the placeholders for the charts
hashArr.map((hash, idx) => {
    createChartDiv(chartHolder, hash, !(idx < 1));
});
The injection scripts from Highcharts Cloud expect to find a placeholder for rendering the charts to. The script is looping over the chart hashes defined and creates successively <div> elements and set the id’s with the following pattern: highcharts-${hashname}.
// create the placeholder for the chart
let createChartDiv = (parentElem, chartHash, hidden) => {
    let script = document.createElement('script');
    script.src = `https://app.everviz.com/inject/${chartHash}/`;
    script.defer = 'defer';
    let div = document.createElement('div');
    div.id = `highcharts-${chartHash}`;
    if (hidden) {
      div.classList.add('hidden');
    }
    div.appendChild(script);
    parentElem.appendChild(div);
  };
Monitor loading the charts
The injection script (https://app.everviz.com/inject/${chartHash}/) loads asynchronous Highcharts libraries, meaning that we have no control over when the charts are created. To tackle that issue, I made a recurring function that
- checks a condition,
- and if true, executes a function, or
- otherwise will spawn a timeout/wait and checks again.
With this, I’m checking for the condition where I can retrieve all three chart titles in the webpage. Chart titles for Highcharts can be simply retrieved with parentElem.querySelectorAll('text.highcharts-title')
The recursive function
let recursiveFunctionWithTimeout = (counter, testFunc, performFunc, wait) => {
    counter--;
    setTimeout(() => {
      if (testFunc()) {
        performFunc();
      } else if (counter > 0) {
        recursiveFunctionWithTimeout(counter, testFunc, performFunc, wait);
      }
    }, wait);
  };
Calling the recursing function will check 50 times with a timeout period of 100 milliseconds.
 recursiveFunctionWithTimeout(
    50,
    () => checkNumberOfNodes(hashArr.length, chartHolder,'text.highcharts-title'),
    () => fillOptionsForDropdownElement(dd),
    100
  );
When the condition is met, the fillOptionsForDropdownElement function executes and creates <option> elements and adds them to the dropdown list.
Retrieve chart titles for populating the dropdown.
let fillOptionsForDropdownElement = (dropdownElem) => {

    //Now the charts have been loaded, loop over the div's to retrieve chart
    //titles and create successively option elements for the dropdown
    for (let chartDiv of chartHolder.children) {
      let hash = chartDiv.id.substr(prefixId.length);
      // search for the chart title, get the first element found.
      let title = chartDiv.querySelector('text.highcharts-title')
        .lastElementChild.innerHTML;
      let option = createOptionForDropdown(hash, title);
      // add the option element to the dropwdown
      dropdownElem.appendChild(option);
    }

    // set selected option
    dropdownElem.options[0].selected = true;
    // bind the change event to it
    dropdownElem.onchange = changeEventHandler;

    // Initially Update the text of the overlay dropdown to the current
    // chart title
    labelElem.innerHTML = dropdownElem.selectedOptions[0].innerText;
  };
Display the selected chart
In the above code snippet, I attached a handler for the onchange event of the dropdown. The handler unhides the selected chart by removing a CSS class and adds it to the other chart placeholders. Note, calling chart.reflow() in the snippet below, this is needed to deal with window resizing and reflowing the chart to its new container.
let changeEventHandler = (event) => {
  // Iterate over the chart containers
  for (let div of chartHolder.children) {
    // If the selection event macthes the chart container hide/unhide it
    if (div.id === prefixId + event.target.value) {
      // Unhide
      div.classList.remove('hidden');
      // Reflow
      Highcharts.charts.map((chart) => {
        // Todo: improve reflow, only for the visible div?
        chart.reflow();
      });
    } else {
      div.classList.add('hidden');
    }
  }
    // set chart title to overlay dropdown
    labelElem.innerHTML = dropdownElem.selectedOptions[0].innerText;
  };
Have fun!
I hope you got the gist of building this widget for displaying charts with a dropdown list.
I would encourage you to play with it on Glitch. You can remix my demo and even improve it. You can, for example, use it as a starting point for coding a charting carousel with Bootstrap Carousel! (Maybe something for the next blog post?)