For businesses to grow in today’s climate, content creators and marketers must think about their strategies on a global scale.
The adaptation of content to suit local audiences is known as content localization. It applies the concept of context to more than just translating words. Localization, at its most basic level, allows your users to connect with your brand on a more personal level.
Content localization can provide a wide range of benefits. User engagement can be increased by connecting with audiences in a thoughtful, natural way. As a result, brand loyalty may improve.
Here we’ll take a quick look at how you can get started with some localizations in your visualization with everviz.
The below sample shows a chart with German language and number- and date formats. Click on the Reuse this chart to copy this project into your account for further investigation.
Basic settings
You can customize the localization settings in the Basic editor by choosing the Localization category in the editor:
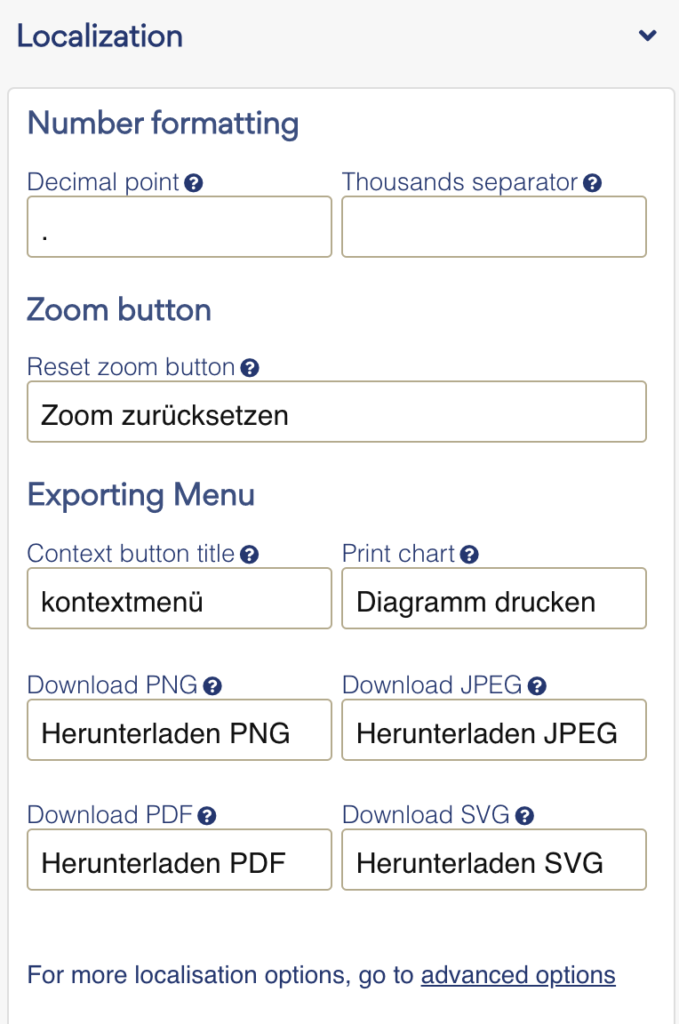
The following main categories are available:
Number formatting
Choose your desired Decimal point and Thousands separator characters.
Zoom button
If your chart or map has zoom enabled, you can customize the label for the reset zoom button to your desired language
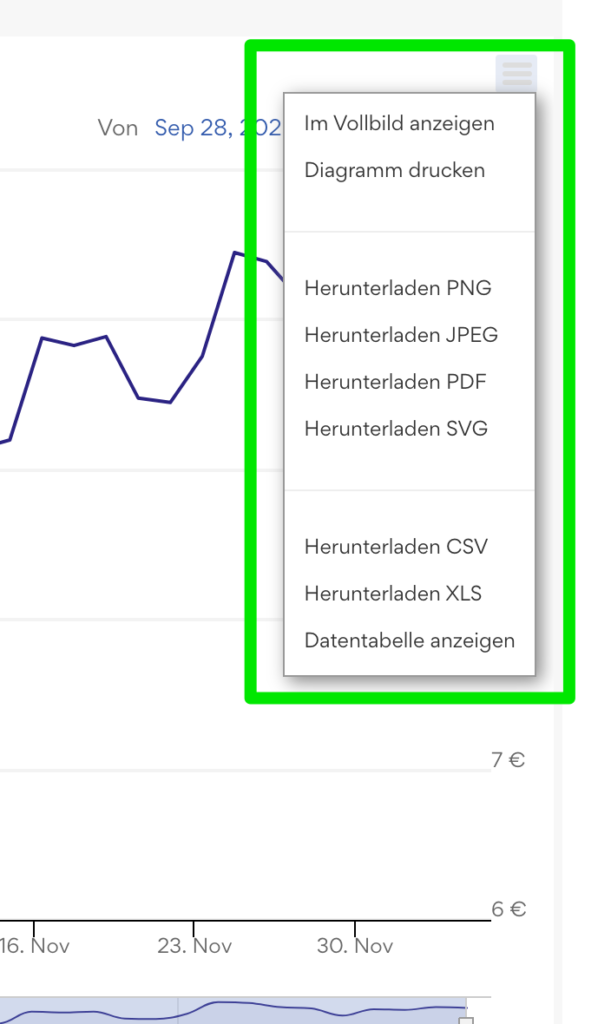
Exporting menu
Under exporting menu, you can customize all the texts that appear in the export menu to your desired language. In the screenshot above, we have changed all the items to German, and the menu will look as follows when published:
More options
Click on the Advanced options to get access to more localization settings
Advanced settings
In the advanced settings you have many different options for localization.
Tip: To avoid configuring localization options every time you create a chart, we recommend to build the settings into Themes. You can read more about Themes here.
The following screenshot shows a few of the options you have access to in the advanced editor:
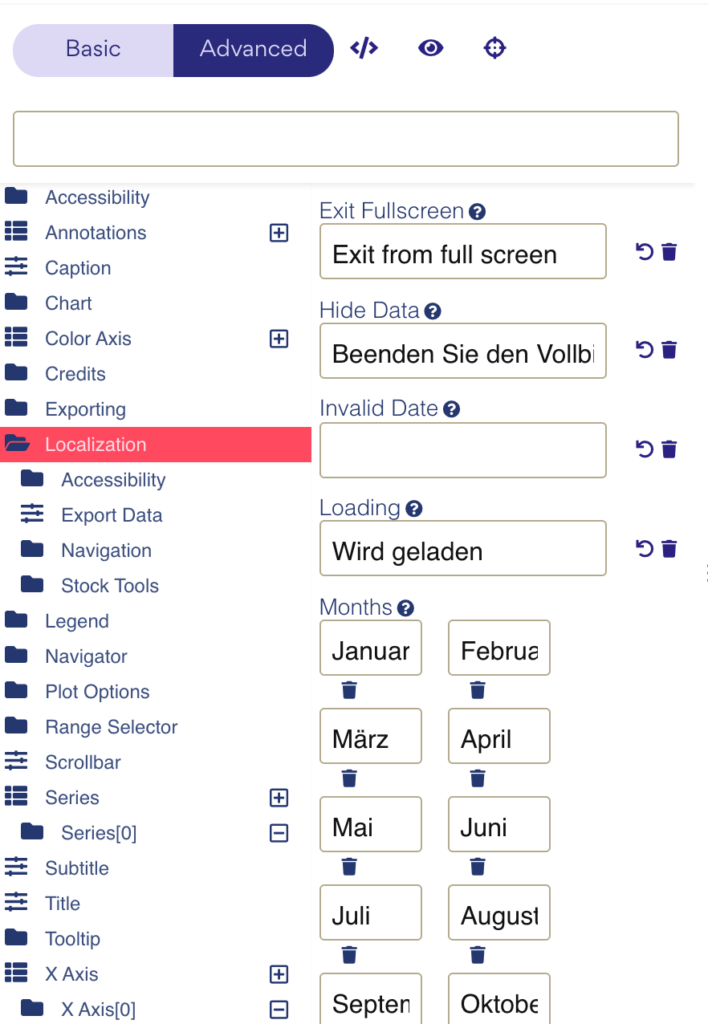
In the advanced editor you can customize all the different text that may appear on your chart including months, weekday names, interactivity features and much more.