In many contexts, low vision only includes impairments that are not corrected with regular glasses, contact lenses, medicine, or surgery. For example, an inability to focus on objects close to the viewer but that can be overcome with reading glasses is not considered low vision in some disability rights contexts. In these contexts, low vision is often defined as visual impairment that interferes with a person’s ability to perform everyday activities.
The World Health Organization (WHO) estimates that there are 246 million people worldwide who have low vision and 39 million people who are blind, meaning that 86% of those with visual impairments have low vision.
Thanks to our core visualization engine, Highcharts, all charts created with everviz support low vision features.
everviz comes with built-in support for Windows High Contrast Mode. Charts can also be viewed in full screen for additional separation of elements. Pattern fills are supported, as well as premade themes with higher contrast. Custom styles are also supported for all visual elements in the chart, and custom themes can be created. By default, series markers have different shapes to help distinguish between data points without the use of color. Due to the responsive nature of everviz, screen zooming tools are well supported.
These features places everviz far ahead in terms of accessibility, compared to our competitors.
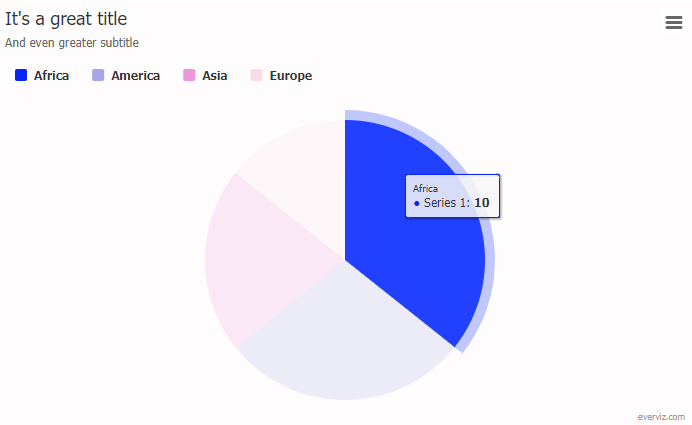
Now, let’s dive deeper into the low vision categories and take a look at some examples, primarily using the pie chart below.
Please note that we’ll use static images of the chart to illustrate some of the examples.
Low vision categories and examples
The World Wide Web Consortium (W3C) introduces five categories of low vision and visual impairment that impact web use, not including total blindness:
1. Visual acuity (clarity)
The clarity or sharpness of eyesight is known as visual acuity. In general, it is reliant on the retinal portion of the eye’s functionality and on the brain’s interpretation.
Some cases of poor vision can be treated with glasses, contacts, or surgery, while other cases cannot. As a result, some people will always have low visual acuity (blurry vision) as illustrated below.
The following everviz features can be helpful for users with visual acuity issues:
Responsiveness
Responsiveness in web terminology simply means that a design or application looks good on all devices. A responsive design will automatically adjust for different screen sizes and viewports, and so it is for visualizations created with everviz as well.
In the everviz editor you can also preview the visualizations created in desktop or mobile view, to check for responsiveness issues.

Crisp magnification of graphics using SVG
By downloading the everviz visualization as an SVG vector image using the visualization context menu, you can magnify the visualization with high quality and crispness.
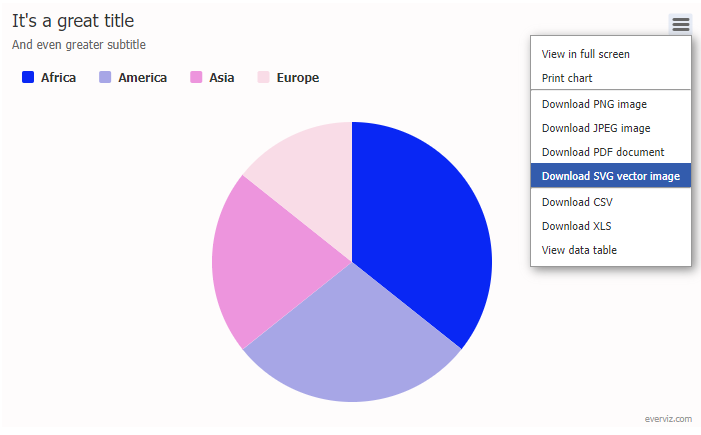
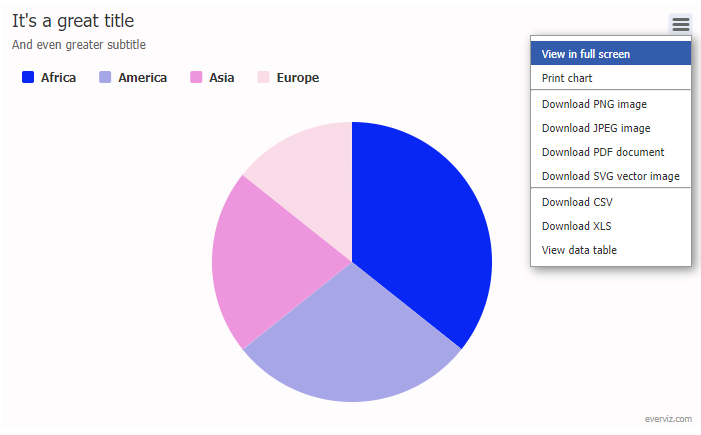
View in full screen
Using the context menu, you can also choose to view the visualization in full screen mode for increased clarity.
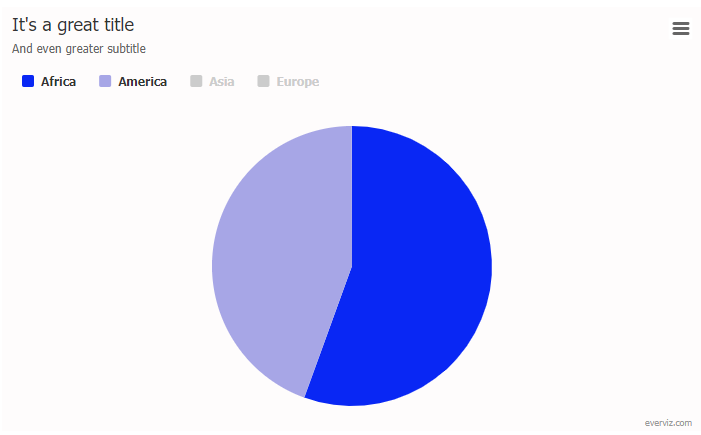
Hide series/points by selecting in legend
By clicking/selecting in the legend, series/points in the visualization can be hidden to better highlight the other ones.
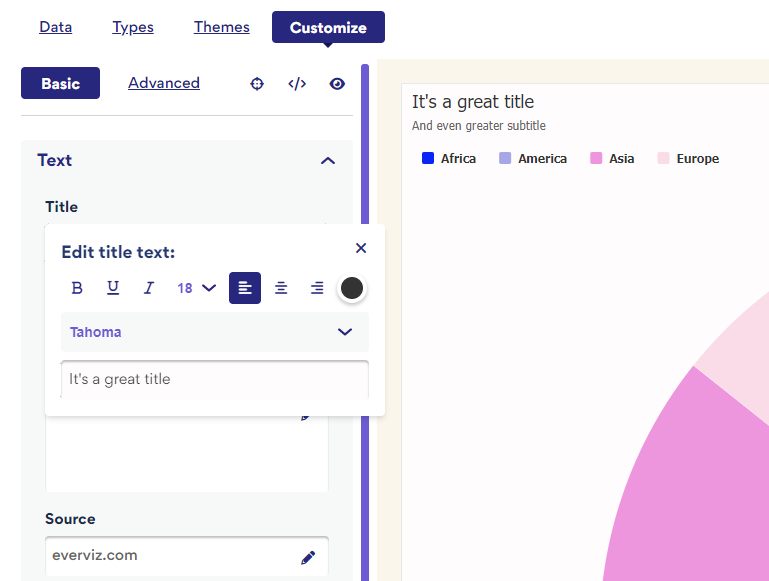
Customizable fonts and font sizes
In the everviz editor you can customize font types, colors and sizes to increase the readability and clarity of visualization titles and descriptions.
2. Light sensitivity
When looking at bright lights or bright areas on paper or computer screens, some people experience pain (called photophobia). Bright light makes it difficult or impossible for them to see, and causes eye pain and headaches. For some people, the normal brightness of a computer screen with a light background is not readable and painful.
Typically those with this condition decrease screen brightness and change the background color darker, when they can.
The following everviz features can be helpful for users with light sensitivity issues:
Custom themes and colors
As previously mentioned, In the everviz editor you can customize font types, colors and sizes to increase the readability and clarity of visualization titles and descriptions. With the everviz themes concept (only on Business and Enterprise plans) you can further create custom themes that can be adapted to those with light sensitivity conditions.

Support for high contrast mode (forced colors/contrast themes) in Windows
Users of high contrast mode have a choice of 4 high contrast themes or can create their own. When they do, their operating system is completely rendered in that theme, including web pages and their content.
The feature is available in all current versions of Windows, though in Windows 11 it’s been renamed to just Contrast Themes. It’s also available in Ubuntu.
Dim other series on hover
Similar to hiding series/points using the legend, visualizations can be created so that other series are dimmed on hover, to better highlight the active one.
Tooltips
Tooltips are the labels that appear when users hover over data points on your chart to get more information. Tooltips in everviz are enabled by default, and you can choose preferred styling and information you would like to include.
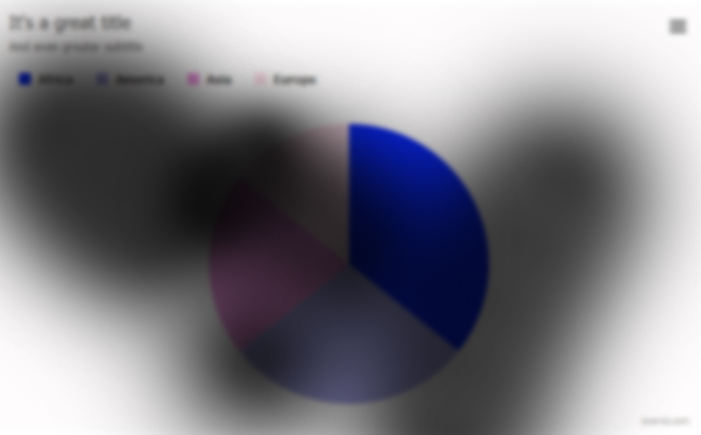
3. Contrast sensitivity
Some people with low vision experience low contrast, meaning that there aren’t very many bright or dark areas in their vision. It is challenging for them to distinguish between outlines, borders, edges, and details because everything has a tendency to appear about the same brightness.
Colors that look very different (for example, red, blue, green) can have similar brightness, and not provide sufficient contrast.
The following everviz features can be helpful for users with contrast sensitivity issues:
Custom themes and colors
Custom themes and colors are previously explained here.
Support for high contrast mode (forced colors/contrast themes) in Windows
High contrast mode is previously explained here.
Dim other series on hover
Dim other series on hover is previously explained here.
Tooltips
Tooltips are previously explained here.
4. Field of vision
The field of vision, also known as the visual field, is the region from which a person’s eye can acquire visual data when looking directly ahead. Typically, a person’s field of vision is 180 degrees from left to right and 150 degrees up and down, with color vision best seen in the middle 5 degrees and sharpest vision in the middle 20 degrees. Field loss is the term used to describe those persons who have a decreased field of vision.
Following is a list of different categories for visual field loss:
- Loss of central field of vision: The middle of a person’s field of vision is diminished or nonexistent.
- People with peripheral field loss can only see in the center of their visual field, a condition known as “tunnel vision.”
- Other field loss: Individuals may experience sporadic spots of vision occlusion, a ring of field loss, field loss in either the left or right eye, or other field loss.
Simulated examples of visual field loss:
The following everviz features can be helpful for users with field of vision issues:
View in full screen
Full screen is previously explained here.
Dim other series on hover
Dim other series on hover is previously explained here.
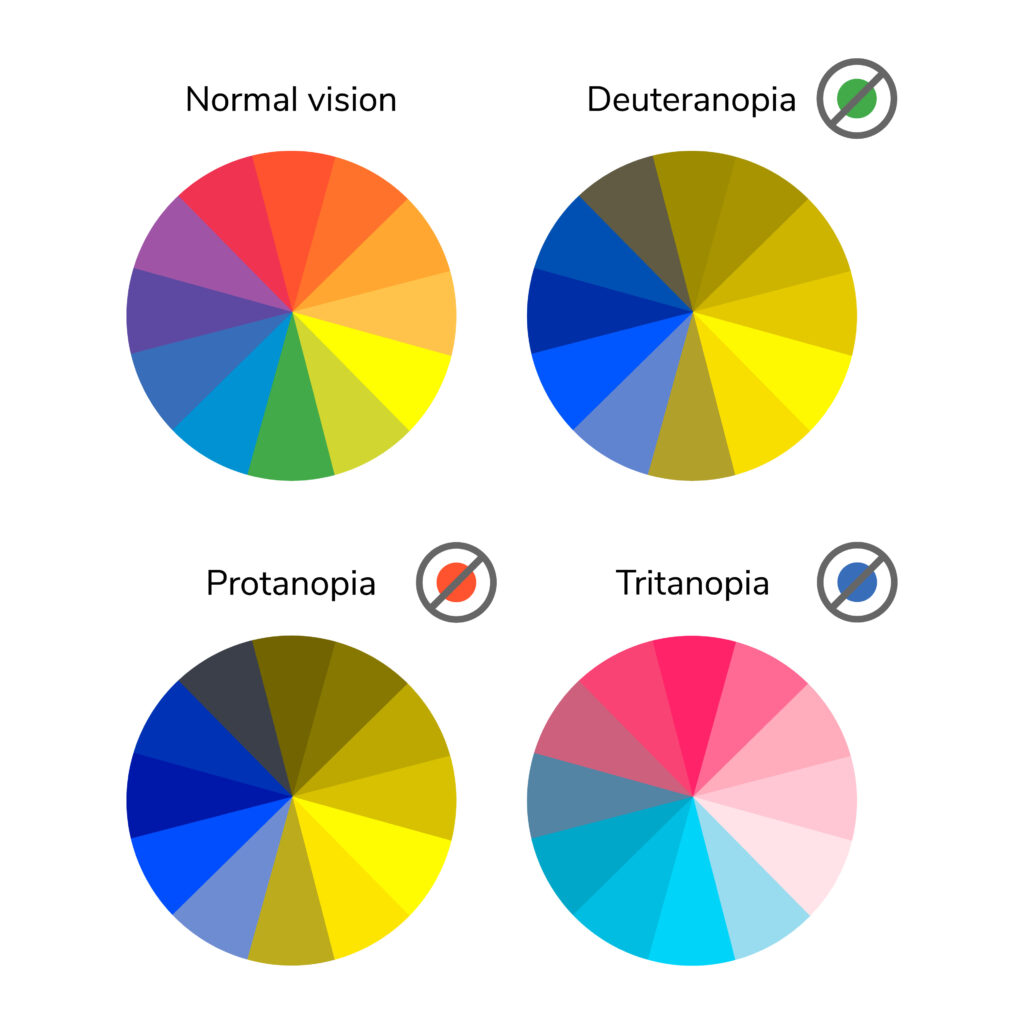
5. Color vision
Due to defects in their eyes’ cone receptors, which are in charge of seeing color, some people are unable to see some colors properly or at all. Even though most people who are color blind can see most colors, this is usually referred to as “color blindness.” Rarely does someone not have any color perception at all.
For those who have poor color vision or low contrast vision, colors may not be easily seen or difficult to distinguish from one another.
Examples of color blindness:
The following everviz features can be helpful for users with color vision issues:
Pattern fills & dash styles
Segments in a visualization can be separated using the pattern fills and dash styles options. However, this requires some custom coding in the advanced editor and on your web pages to achieve. Read more about it in this article in the knowledge base: https://help.everviz.com/article/834-separate-pie-segments-by-patterns
Custom colors
Custom colors are previously explained here.
Support for high contrast mode (forced colors/contrast themes) in Windows
High contrast mode is previously explained here.
Hide series/points by selecting in legend
Hide series/points by selecting in legend is previously explained here.
Tooltips
Tooltips are previously explained here.
Intersted in learning more about low vision and visualizations with everviz?
Drop us a line at [email protected] or simply use the form below.


