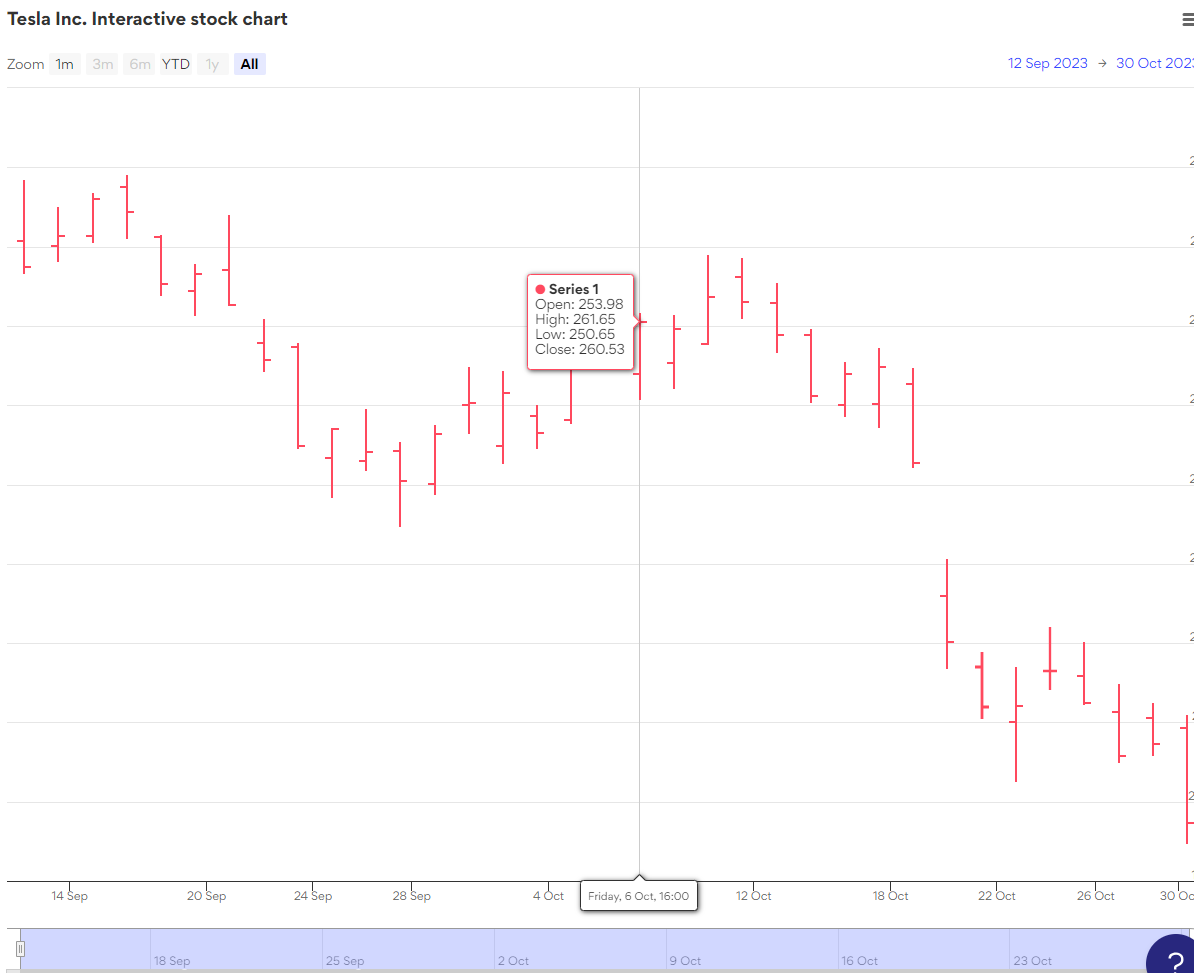
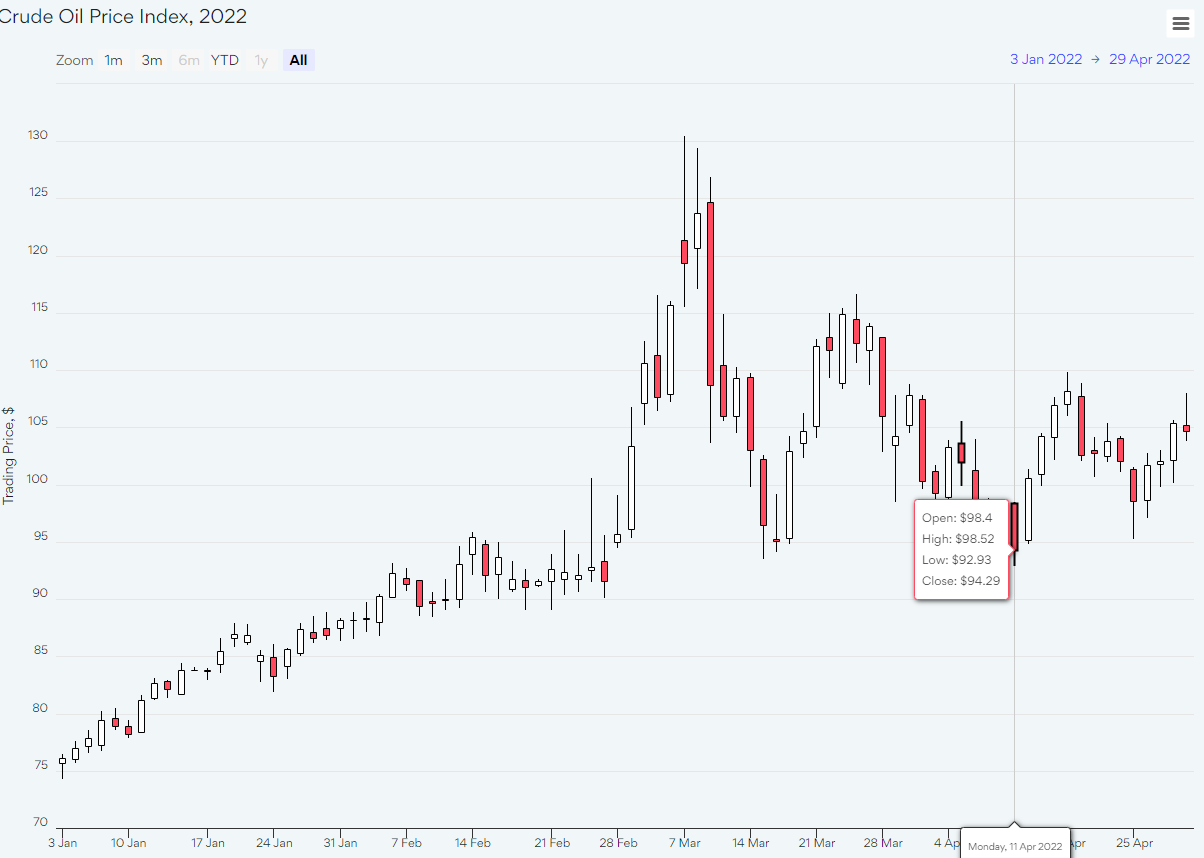
A candlestick chart (also called Japanese candlestick chart) is a style of financial chart used to describe price movements of a security, derivative, or currency. Below sample is for the Tesla Stock.
everviz is a multiplatform visualization solution that lets you create interactive charts and maps online for publishing on your website, social media or through your cloud-based newsroom system.
It only takes a minute to create your first visualization.