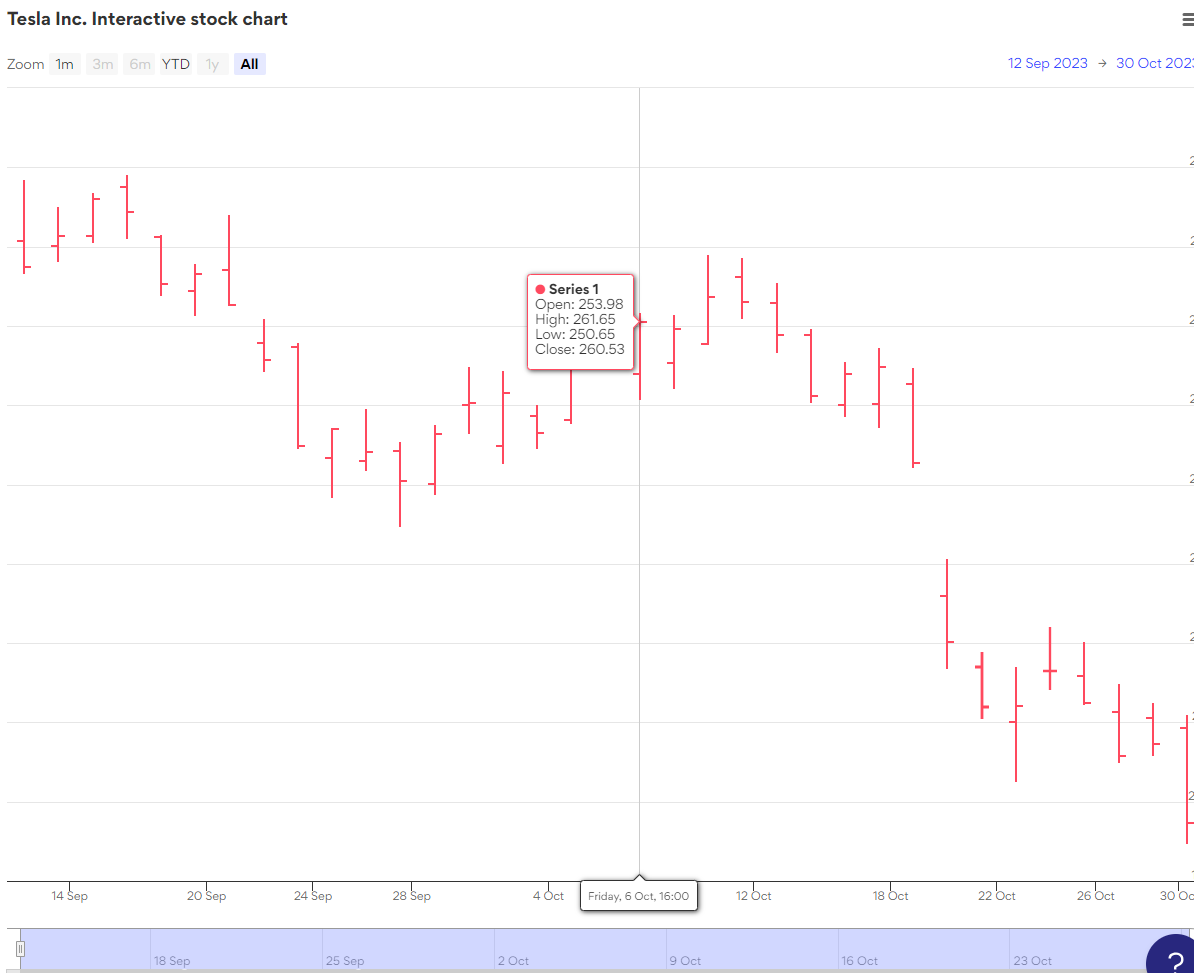
The “Crude Oil Price Index, 2022 – Stock chart” is an interactive financial visualization that provides a dynamic overview of the performance of the crude oil market in the year 2022. This interactive stock chart offers users the ability to explore and analyze the fluctuations, trends, and key statistics related to crude oil prices throughout the year.
Users can engage with this stock chart to select specific timeframes, view historical data, and track the daily, weekly, or monthly performance of the crude oil market. The chart typically represents oil prices using a line graph or candlestick chart, showcasing opening and closing prices, as well as high and low points during trading periods.
This interactive chart is an invaluable tool for investors, traders, and anyone interested in the energy sector. It allows for in-depth analysis of the factors influencing crude oil price movements, such as geopolitical events, supply and demand dynamics, and economic trends.
By providing a detailed visual representation of the crude oil market in 2022, the “Crude Oil Price Index, 2022 – Stock chart” enables users to make informed decisions regarding energy investments, risk management, and market strategies. It’s a valuable resource for keeping a pulse on a commodity that plays a pivotal role in the global economy.
Whether you are a professional in the financial industry or a casual observer interested in energy markets, this interactive stock chart is a powerful tool for understanding and tracking the complex world of crude oil pricing.