The “Tesla Inc. interactive stock chart” is a dynamic financial visualization that provides a real-time and interactive representation of the stock performance of Tesla Inc., one of the world’s most renowned electric vehicle and technology companies. This interactive stock chart empowers users to closely monitor, analyze, and respond to the ever-changing dynamics of Tesla’s stock market journey.
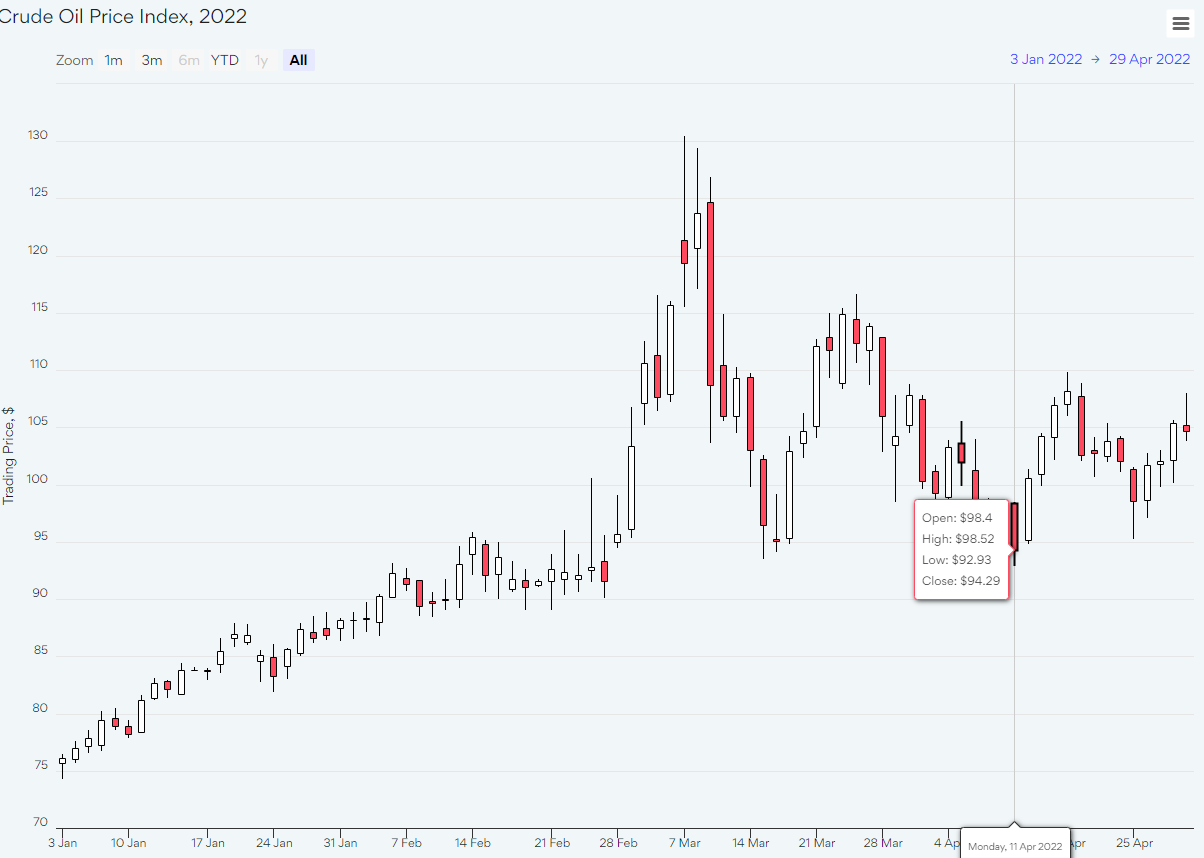
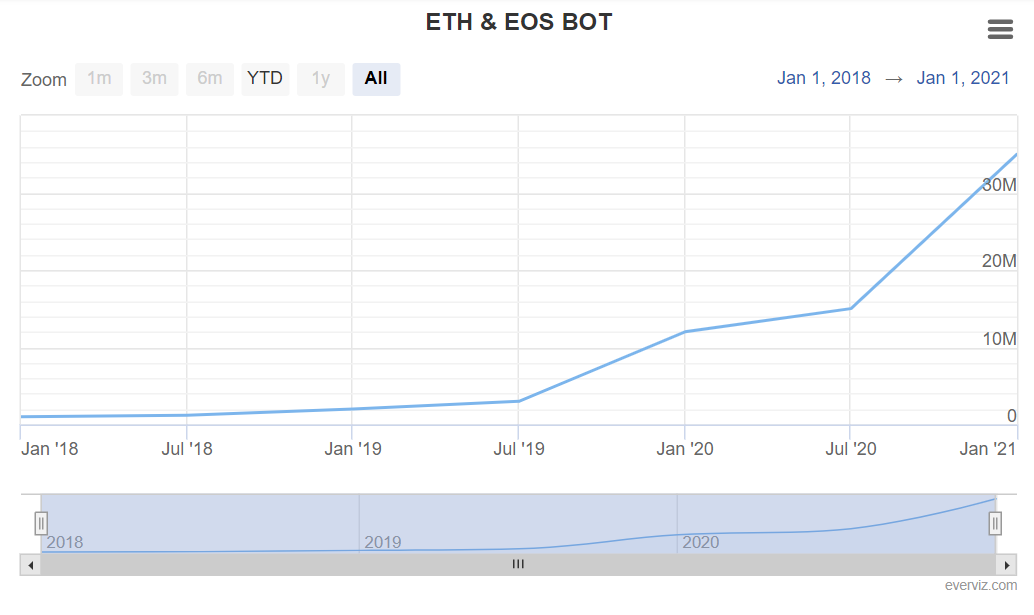
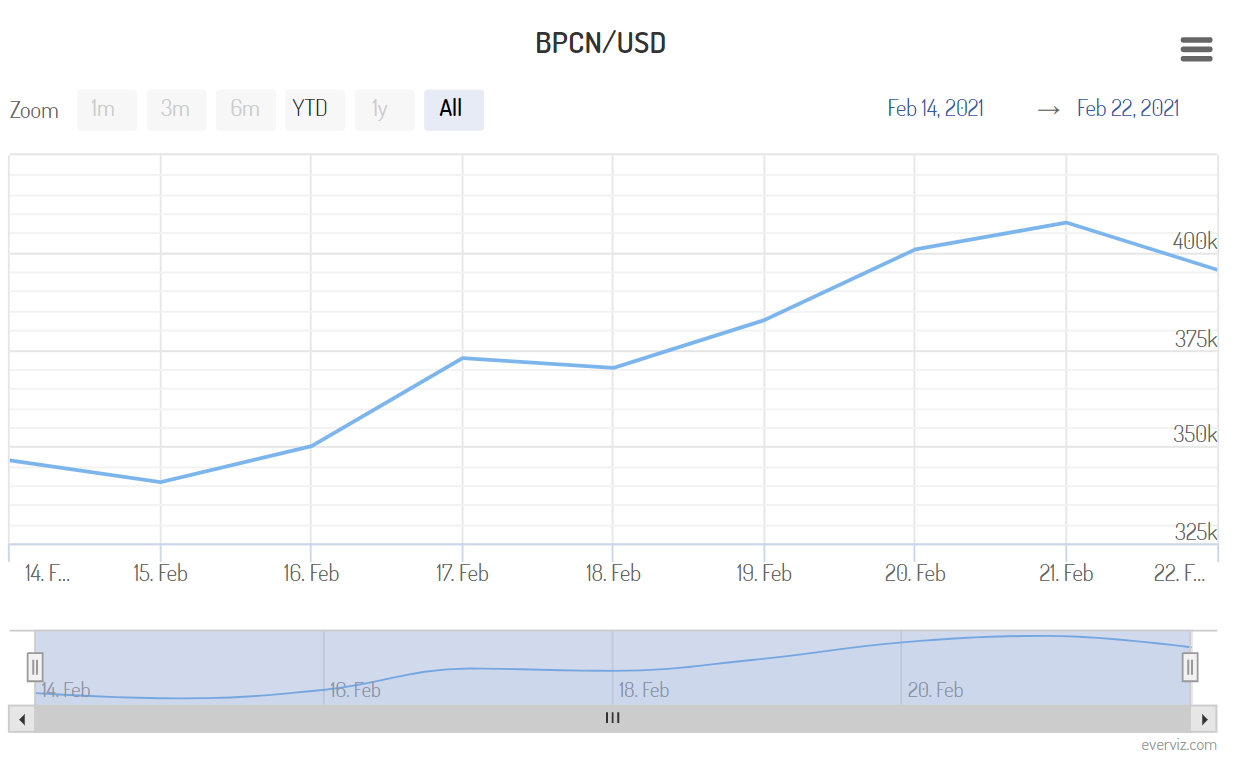
Users can engage with this stock chart to access a wide array of features, such as selecting different timeframes (daily, weekly, monthly, or custom intervals), viewing historical price data, and conducting technical analysis with various indicators. The chart typically displays Tesla’s stock prices as candlestick charts or line graphs, providing insights into the opening and closing prices, as well as highs and lows during trading sessions.
This interactive chart is an indispensable tool for investors, traders, and Tesla enthusiasts seeking to stay informed about the company’s stock performance. It allows users to keep track of factors that influence Tesla’s stock, including quarterly earnings reports, product launches, regulatory changes, and industry trends.
The “Tesla Inc. interactive stock chart” serves as a vital resource for making well-informed investment decisions, managing portfolios, and understanding the complexities of the dynamic electric vehicle market. Whether you’re a seasoned trader or a Tesla enthusiast, this interactive stock chart provides the tools needed to stay updated and navigate the world of Tesla’s stock market performance.