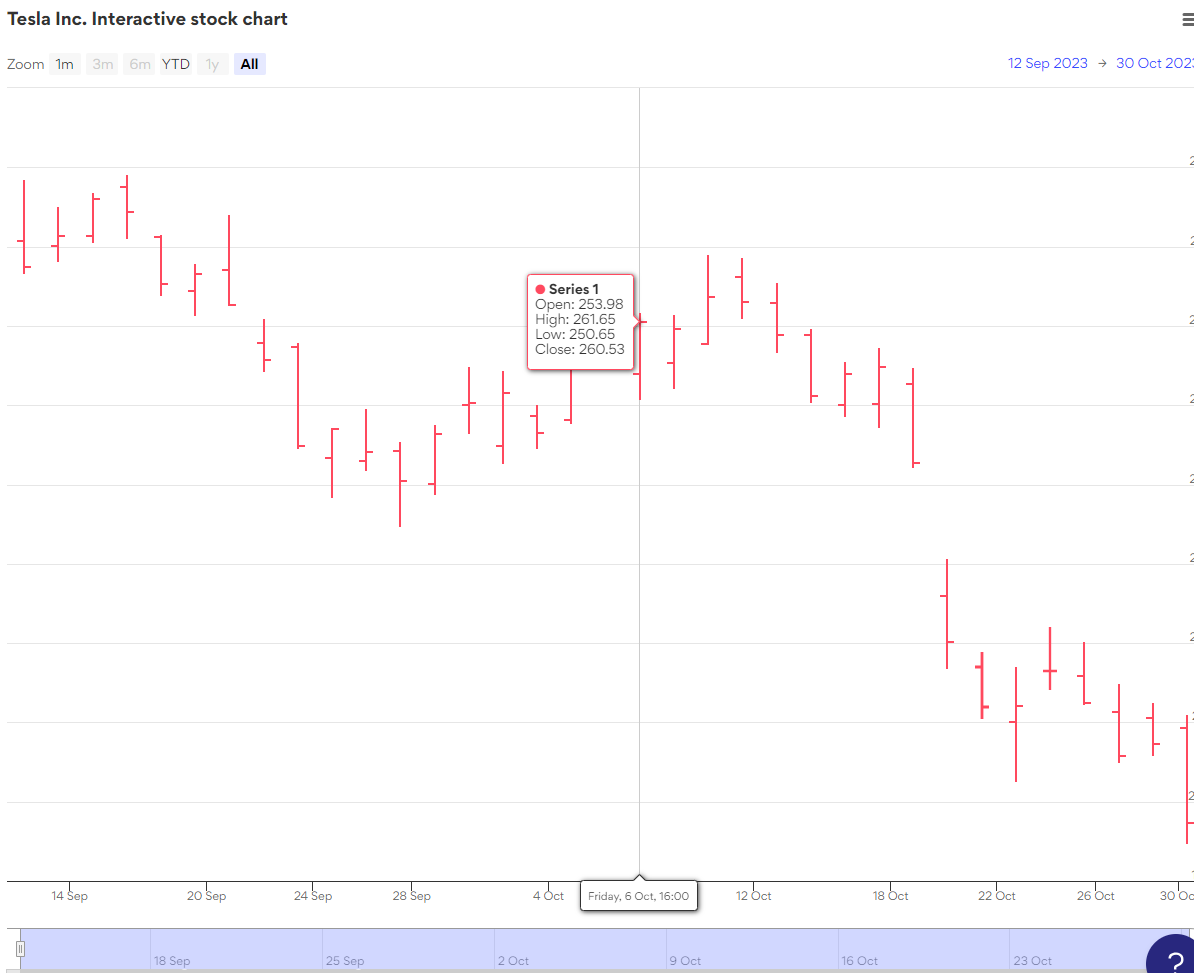
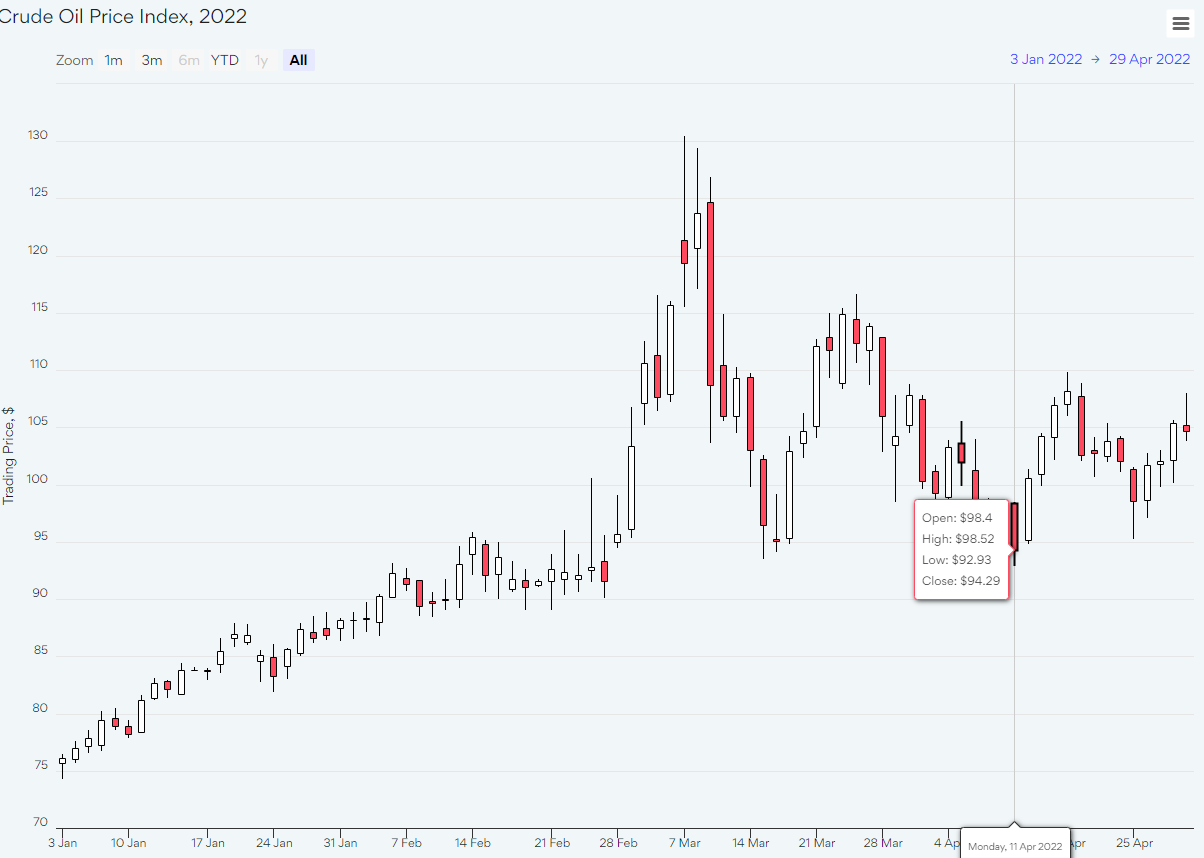
An OHLC chart is a type of bar chart that shows open, high, low, and closing prices for each period. OHLC charts are useful since they show the four major data points over a period, with the closing price being considered the most important by many traders.
The chart type is useful because it can show increasing or decreasing momentum. When the open and close are far apart it shows strong momentum, and when the open and close are close together it shows indecision or weak momentum. The high and low show the full price range of the period, useful in assessing volatility. There several patterns traders watch for on OHLC charts.