


The Telegraph’s inclusive approach to visualizing the news
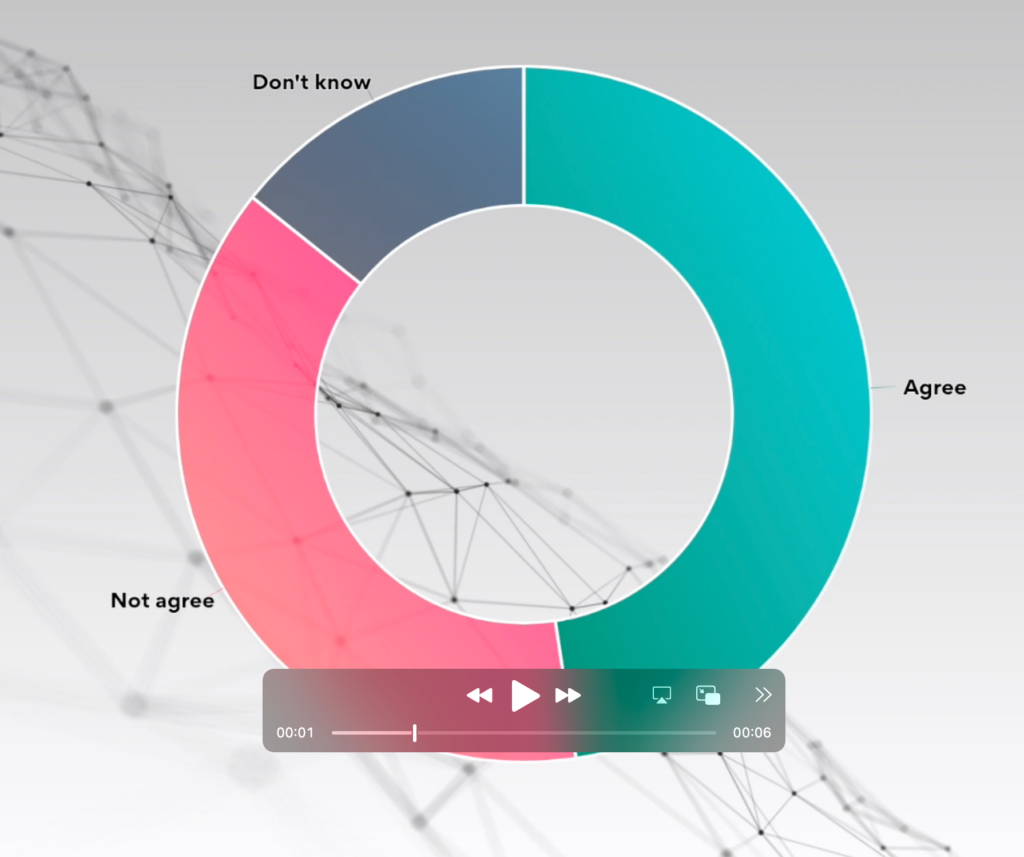
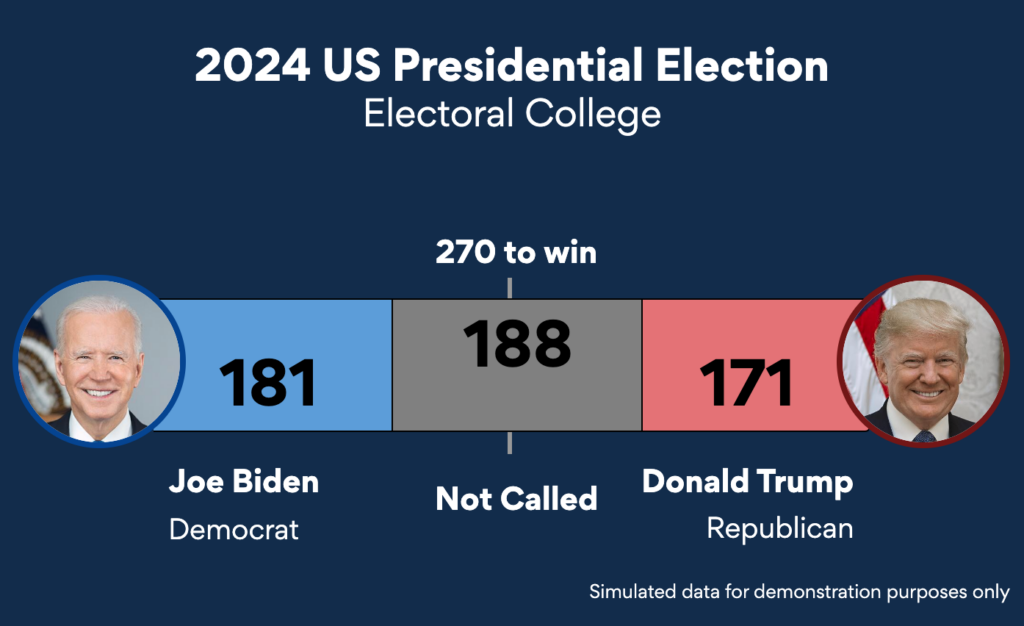
Simplifying complex information in news stories is key to reader engagement at The Telegraph. Charts and maps from everviz help readers understand at a glance current events related to macroeconomic trends, health statistics, financial markets information, and the manufacturing sector. Inclusivity and reader engagement are two pillars of their use