How to create financial data visualizations
It can be difficult to communicate financial information to different audiences, but a well-designed graph or chart can help you to get your message across.

It can be difficult to communicate financial information to different audiences, but a well-designed graph or chart can help you to get your message across.

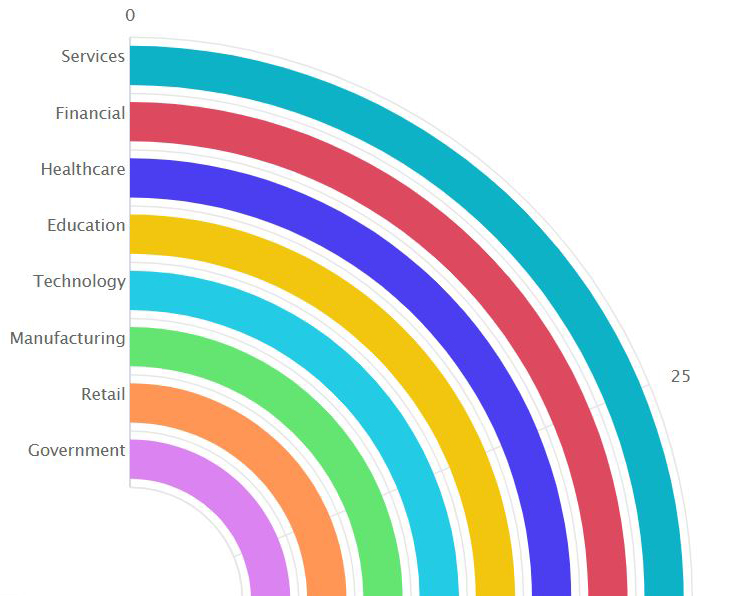
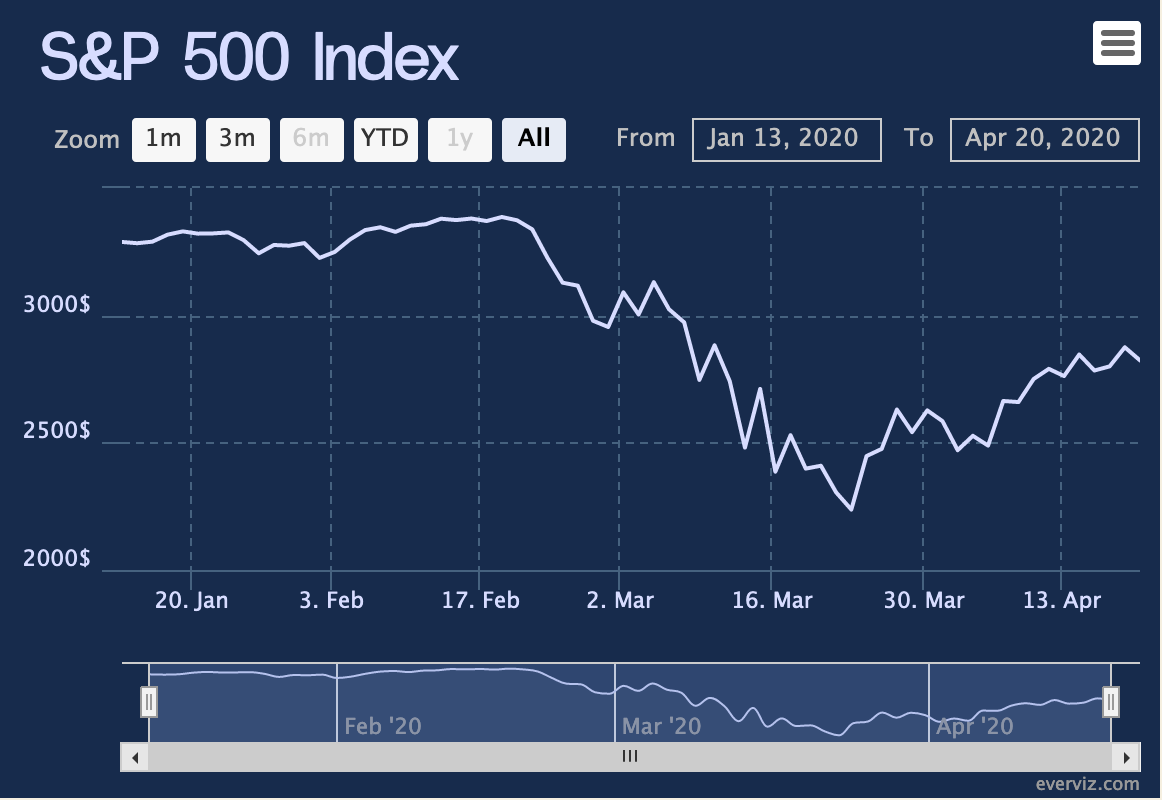
In this post we play around with stock market data in order to explore how everviz can help you take your visualizations to the next
Lars Hilles gate 39, 5008 Bergen, Norway
everviz © All rights reserved
everviz is a service by Visual Elements of Norway