Which candidate has the winning odds in the Electoral votes – Honeycomb map

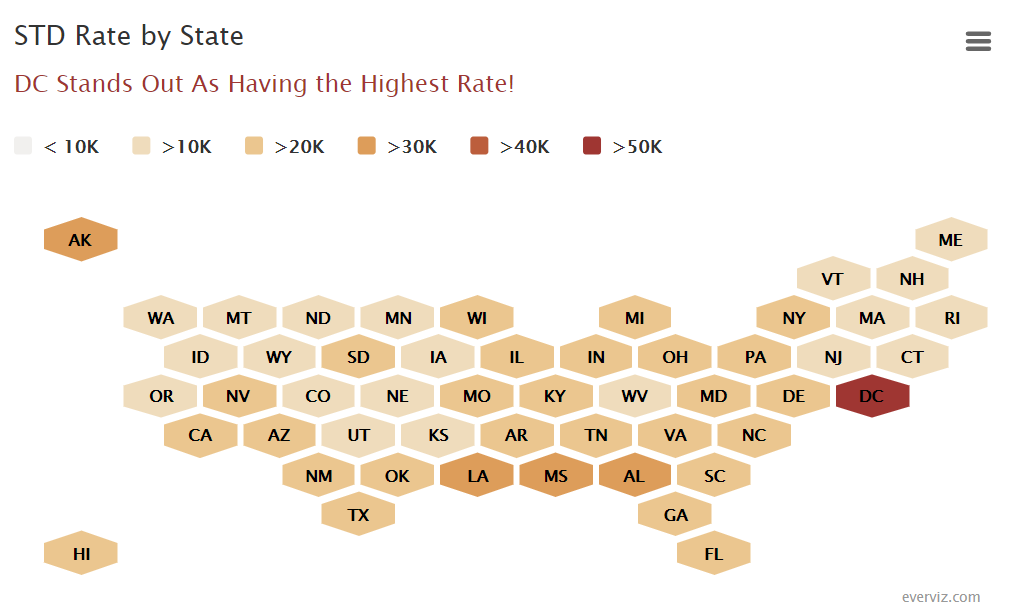
Hexagonal tilemap, sometimes referred to as a honeycomb or hexbin chart, showing election data in the US.

In this case the map is used to show each US state with the same size – which removes some of the bias associated with traditional maps.


everviz is an online visualization tool that helps you create interactive charts and maps.

Embed your interactive visualizations on your website, blog or intranet. You can also export them as images or PDF for offline and print.

Enter data directly, drop a CSV file into the editor, copy & paste from Excel, or connect to live data via our Google Sheet inte­gration.

Our intuitive editor lets you choose chart type, edit text, fonts and colors to make your data stand out.