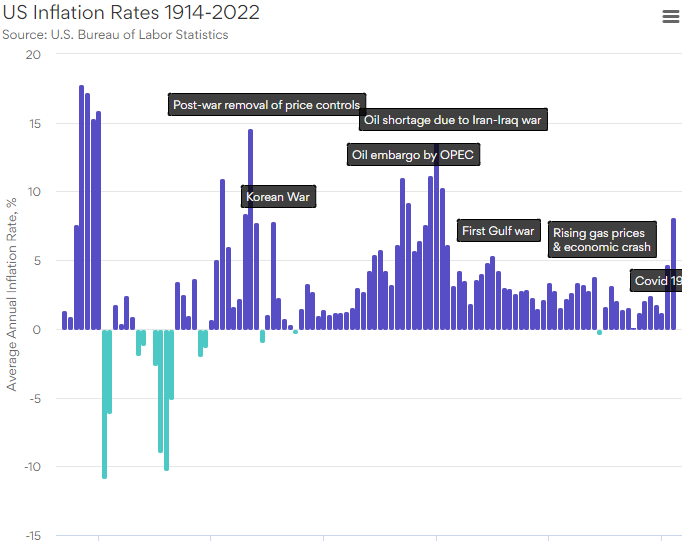
Wind Rose for South Shore Met Station – Wind Rose diagram

A wind rose is a visualization used by meteorologists to give a succinct view of how wind speed and direction are typically distributed at a particular location.

Below example taken from South Shore Met Station.
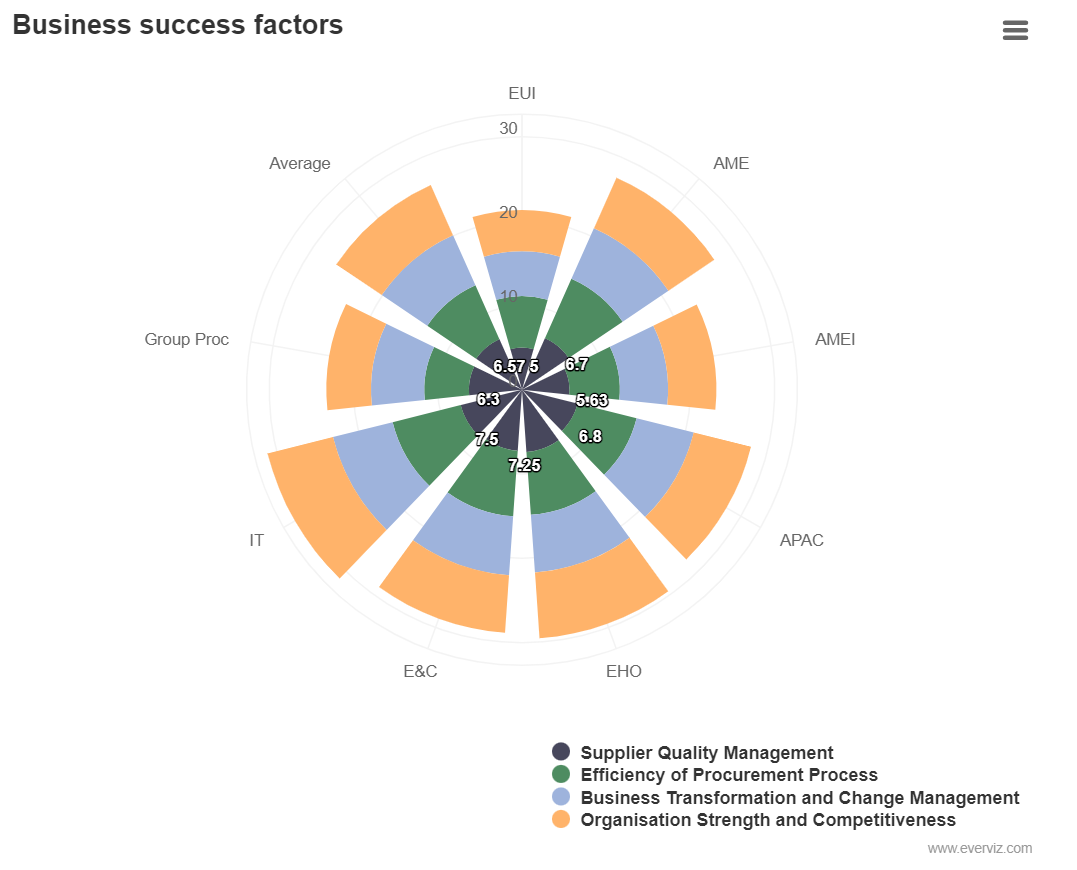


everviz is an online visualization tool that helps you create interactive charts and maps.

Embed your interactive visualizations on your website, blog or intranet. You can also export them as images or PDF for offline and print.

Enter data directly, drop a CSV file into the editor, copy & paste from Excel, or connect to live data via our Google Sheet inte­gration.

Our intuitive editor lets you choose chart type, edit text, fonts and colors to make your data stand out.