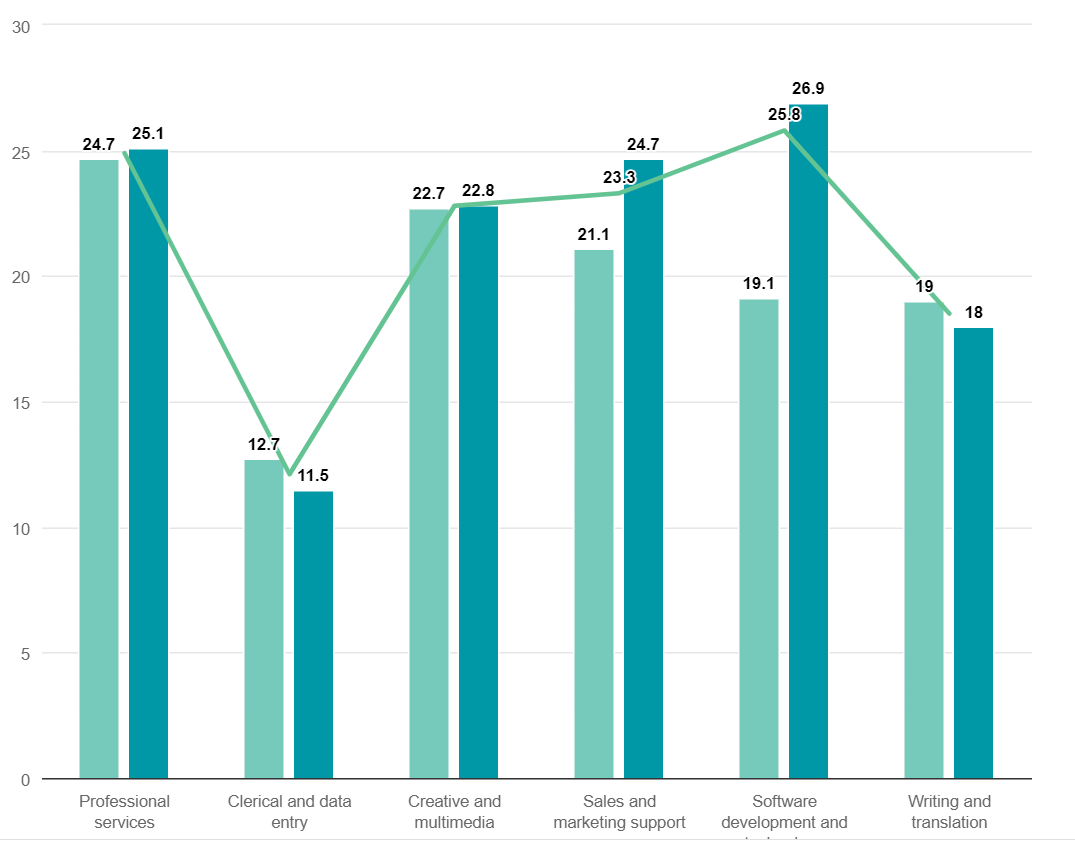
According to a 2015 Metropolitan Planning Council (MPC) article, “It takes an entire year for Chicago to grow as much as Nashville does in one day.” In it, author Chrissy Mancini Nicols writes:
I read a stat that Nashville grows by 80 people a day. Of all the stats I read on a daily basis, this one stuck with me—Chicago only grew by 82 people in all of last year! The Nashville region is expected to grow by almost 40% over the next 15 years, adding roughly 500,000 people, while Chicago—a region currently four times the size—will only grow by 7%, or 640,000 people.
MPC’s bar graph show the disparity between the Chicago and Nashville area growth rates over a three-year time period. That was three years ago and the city continues to experience the “boomtown” growth rates that surprise so many people outside Music City limits. Who isn’t surprised? Anyone who has started to bemoan increasingly congested traffic around the city they love so much they can’t begrudge all the newcomers for long.