This chart has its advantages as a geographical tool, but it doesn’t actually show you any data in the sense of metrics. This is a great way to make a custom map that only shows the cities my audience needs to know about.
Sometimes trying to find a map that shows the exact level of detail that you want, without crowding the image, is a very trying task.
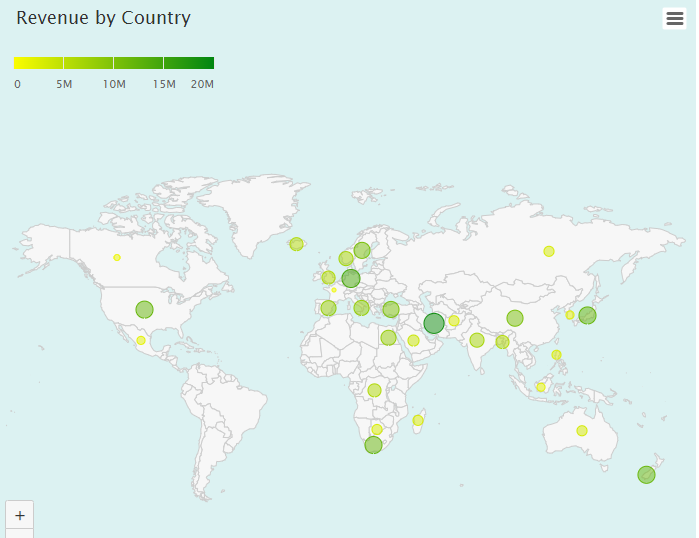
For a business context this would be a great tool to show my global presence with dots for each ice-cream shop in each city. Seeing this makes me want to plot out an expansion strategy using this map. I could show two maps side by side: (1) the current map and (2) what the map could look like in 5 years’ time. That’s some good motivation to get the work done.
Sometimes trying to find a map that shows the exact level of detail that you want, without crowding the image, is a very trying task.
For a business context this would be a great tool to show my global presence with dots for each ice-cream shop in each city. Seeing this makes me want to plot out an expansion strategy using this map. I could show two maps side by side: (1) the current map and (2) what the map could look like in 5 years’ time. That’s some good motivation to get the work done.