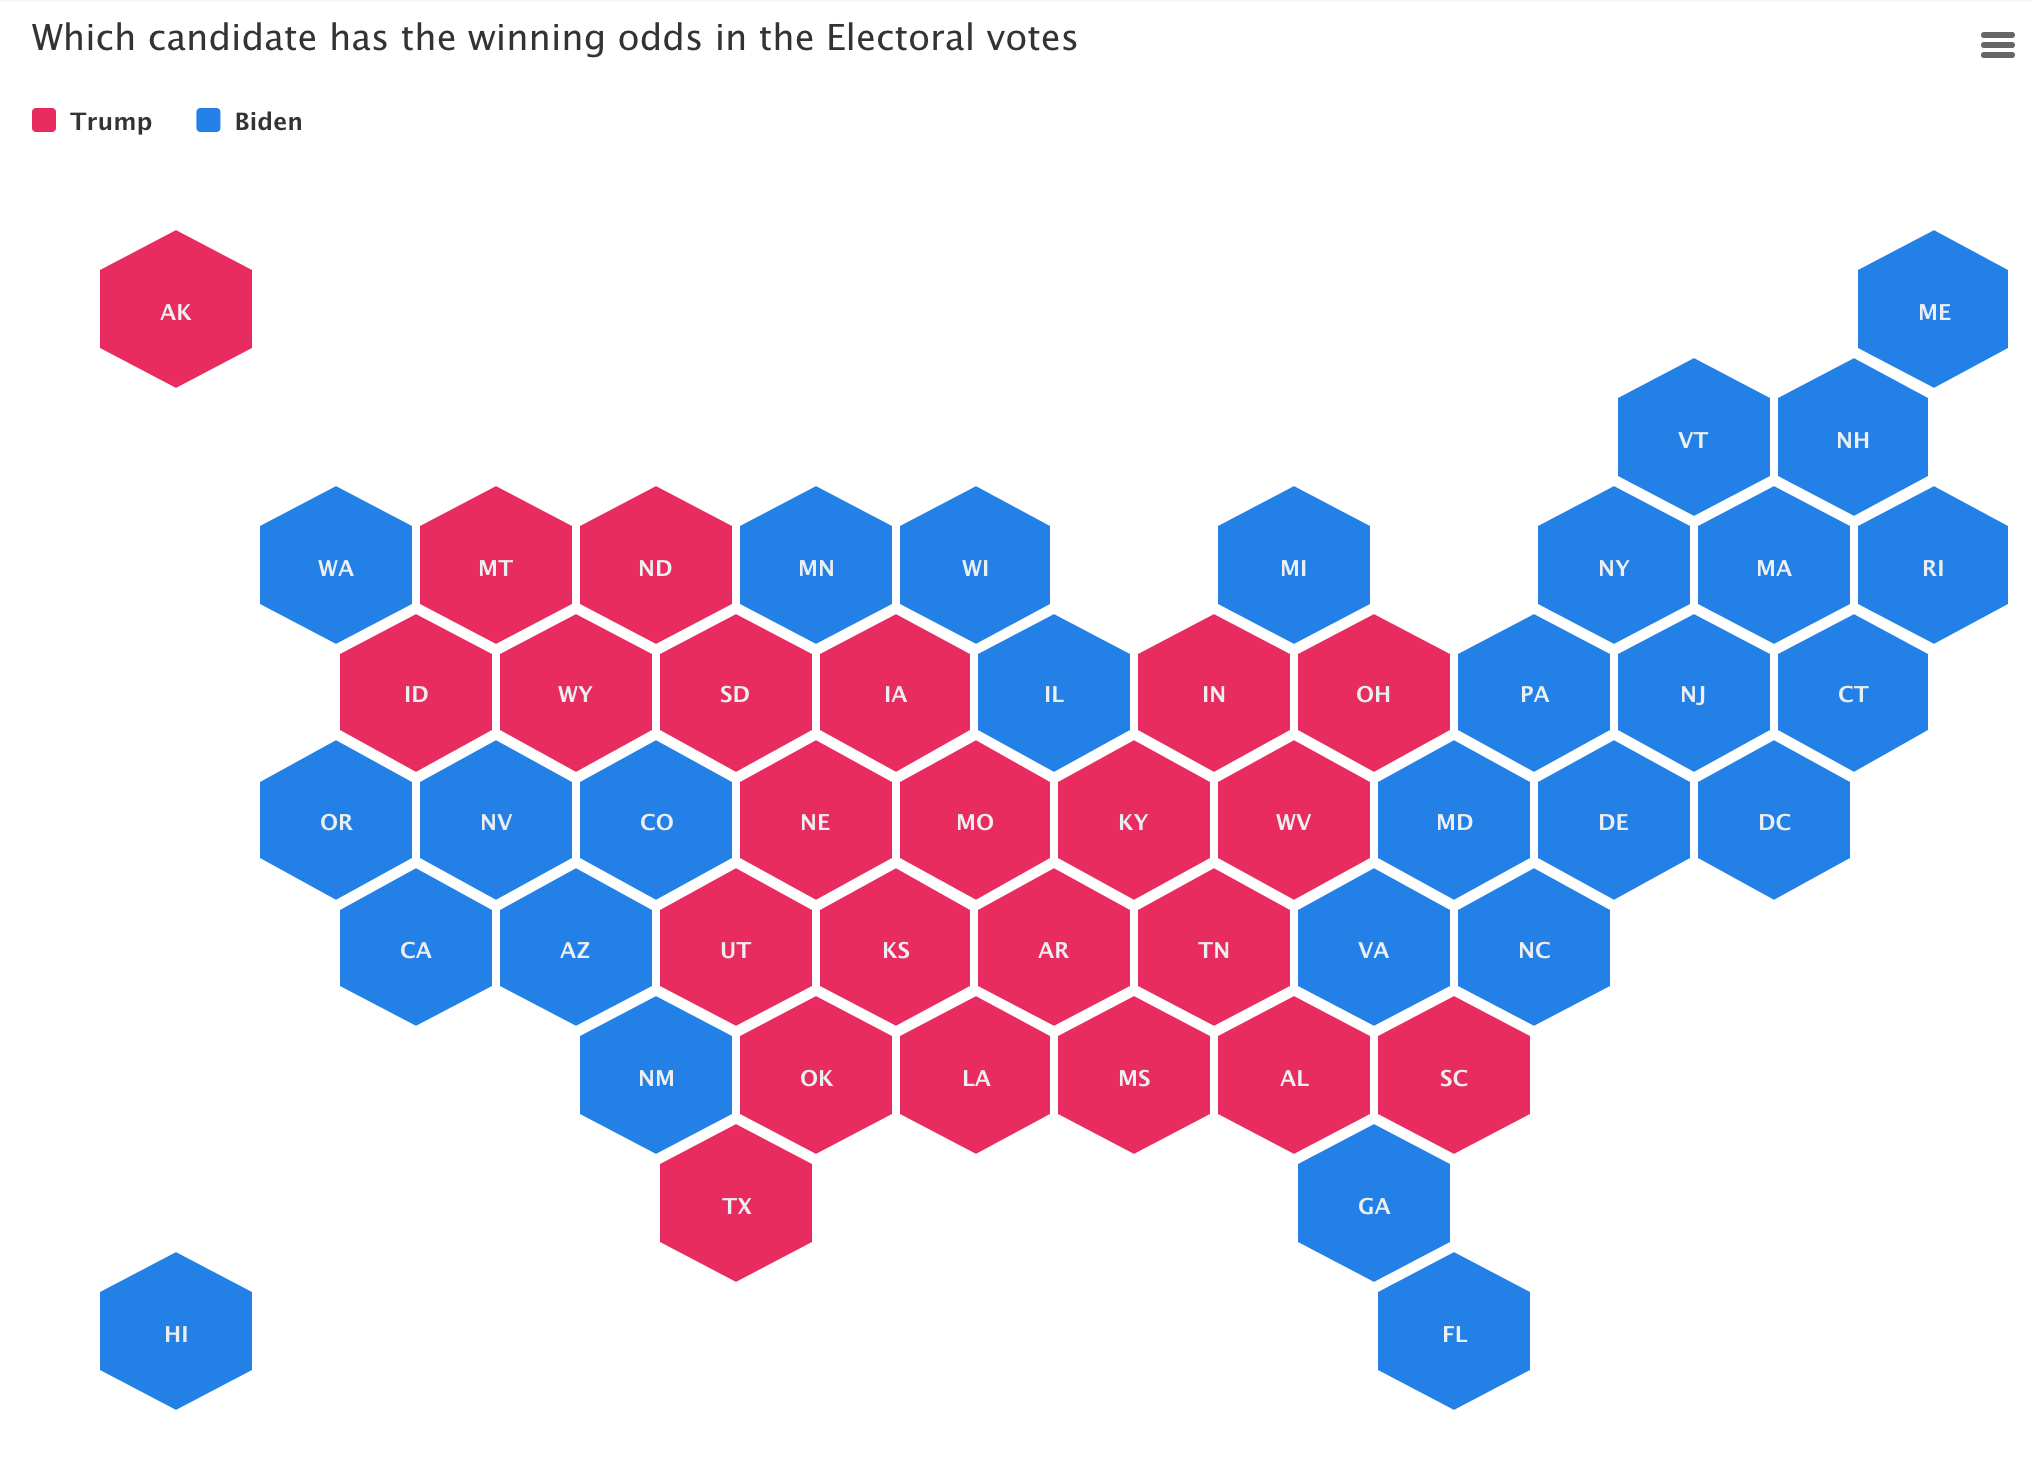
Visualize election data with election packages
During election times, readers want more than just good writing, they want great graphics and interactive charts and maps. We believe the time is ripe
During election times, readers want more than just good writing, they want great graphics and interactive charts and maps. We believe the time is ripe
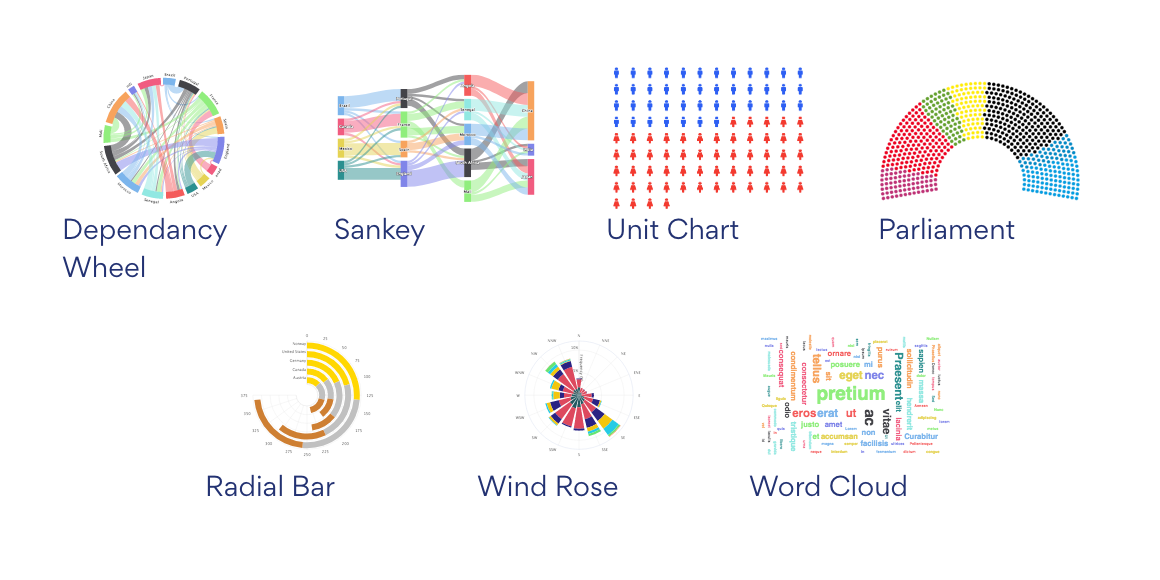
We have just added more chart types to everviz. Parliament chart, Word Cloud, Unit Chart, Sankey, Dependency Wheel, Radial Bar chart. Check it out! Check out some samples
