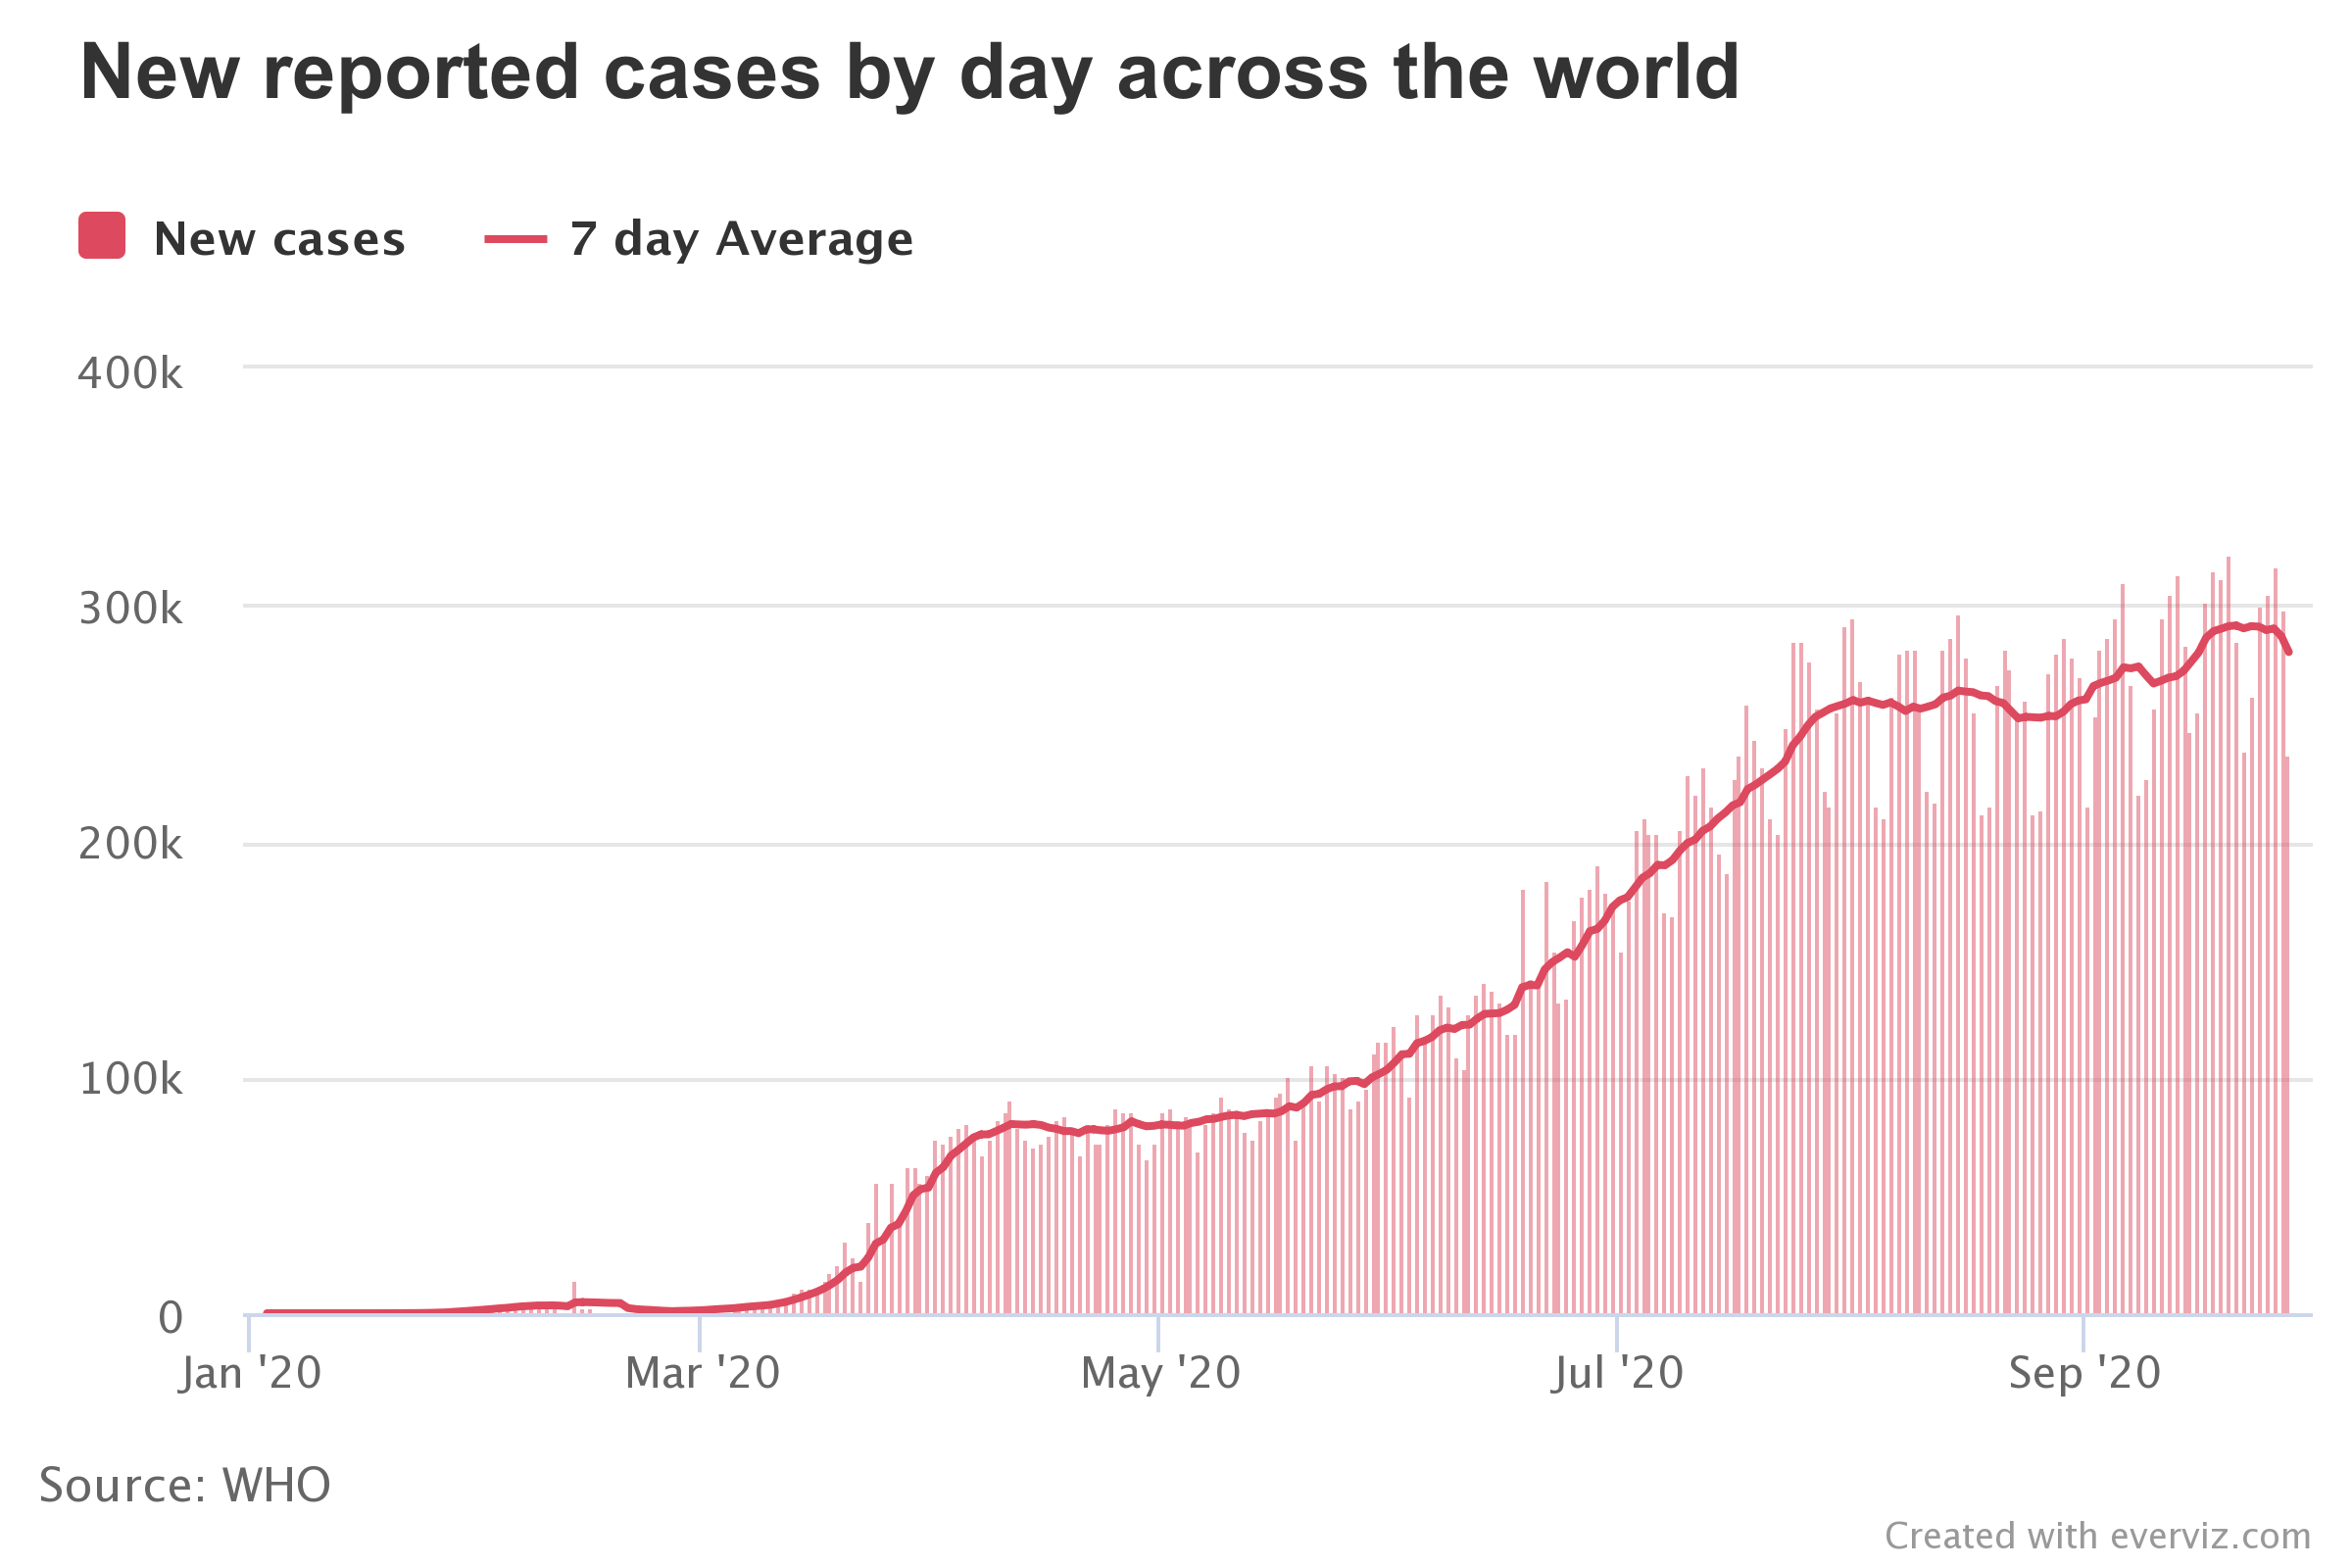
Create covid graphs like the pros in three steps
Covid graphs are all around us. In this article we show how you can create graphs like the Pros without help from programmers or designers.
Covid graphs are all around us. In this article we show how you can create graphs like the Pros without help from programmers or designers.
For visualization, spreadsheet tools such as Excel, Google Sheets, LibreOffice, etc. are often used to enter, organize and sort data. Then, one may look for ways to visualize the data using built-in charts’ functionality or his/her favorite 3rd party tool. In this guide, I will show you how to use any spreadsheet tool together with everviz to create a chart that communicates your data most effectively.
