We strongly believe that telling stories with visuals makes the message easier to understand and act upon. Visuals created with everviz are Interactive, responsive and accessible out of the box. This post explains what we mean by this.
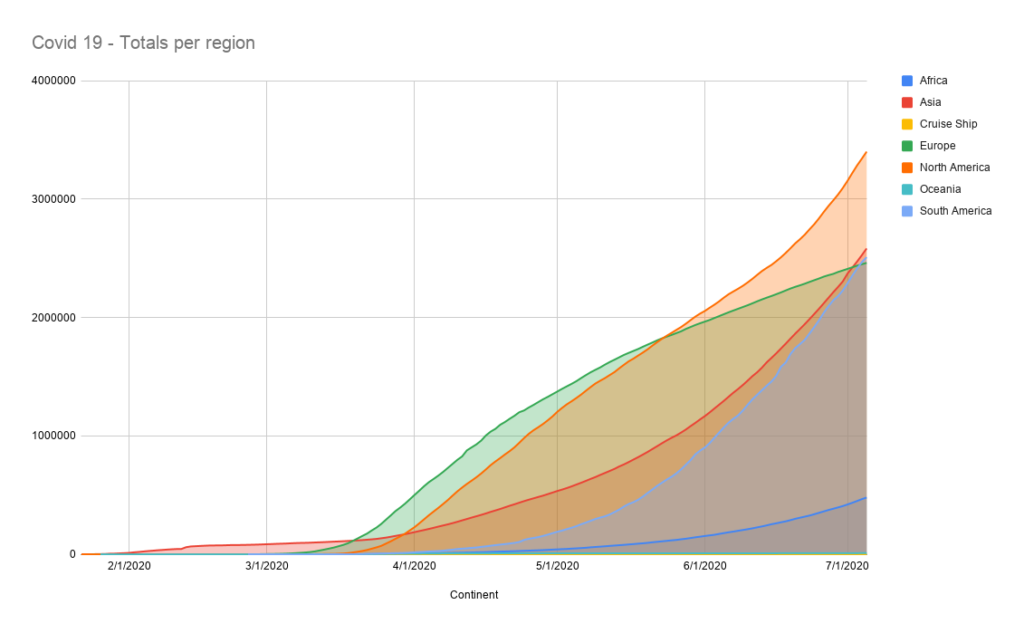
To start, it is probably easier to show you what we do NOT mean. The following static image of a chart is neither interactive, responsive nor accessible:
At the other end of the scale, here is a chart created with everviz which contains accessibility, interactivity and responsiveness out of the box:
Let’s go through the different concepts one by one
Accessibility (a11y)
Our mission is to enable our customers to reach out with news and insights to the largest possible audience.
Thanks to the efforts from our mothership in Highcharts, all charts created with everviz are rendered so that people with disabilities can use them.
This encompasses disabilities such as auditory, cognitive, neurological, physical, speech and visual impairments.
All visuals created with everviz include accessibility functionality out of the box including
- Support for keyboard navigation
- Navigating and reading with a screen reader
- Full screen view
- Data tables
- Touch support
Accessibility is a large topic in everviz, and will be followed by numerous articles.
Responsive
Responsive design is an approach that makes the visualizations render well on a variety of devices and window screen sizes.
If you resize the browser window you will see that the everviz chart above is automatically adjusted.
All visuals created with everviz will automatically adapt to its given screen size. It will justify information to make it readable on small mobile devices to large TV screens. This is happening automatically, and the user does not have to create multiple versions.
The image above, has no idea of which screen size it is being displayed on so it will end up being very hard to read on a small mobile screen.
Interactive
Interactive charts allow your audience to engage with your visual and make it easier to understand.
All visuals created with everviz comes with interactivity functionality out of the box, and allows your audience to zoom, highlight specific data, download, hover to get more information and much more. The everviz user can easily specify which operations and information shall be available to the audience.
Not already an everviz user?


