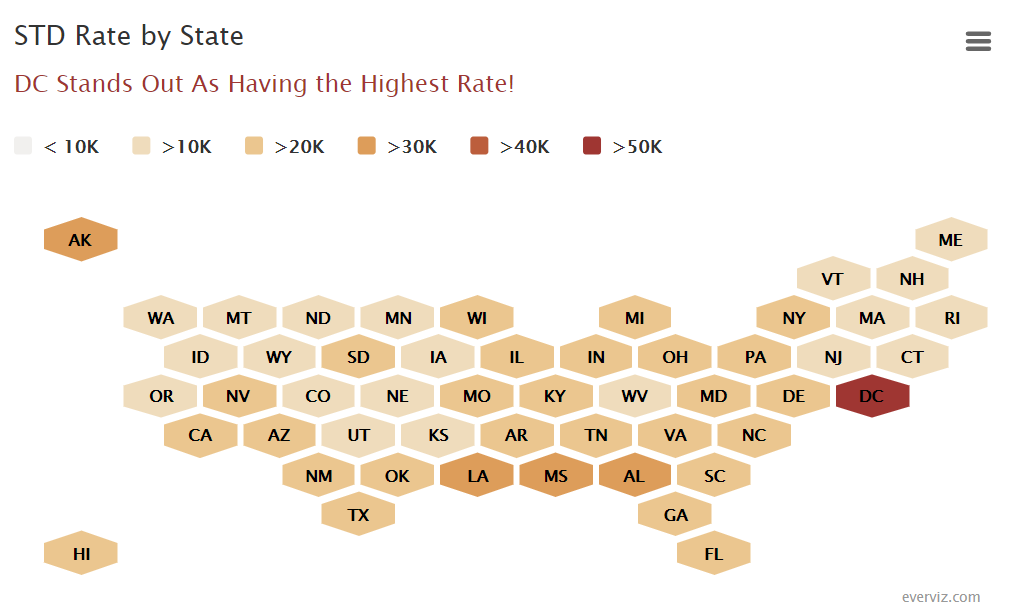
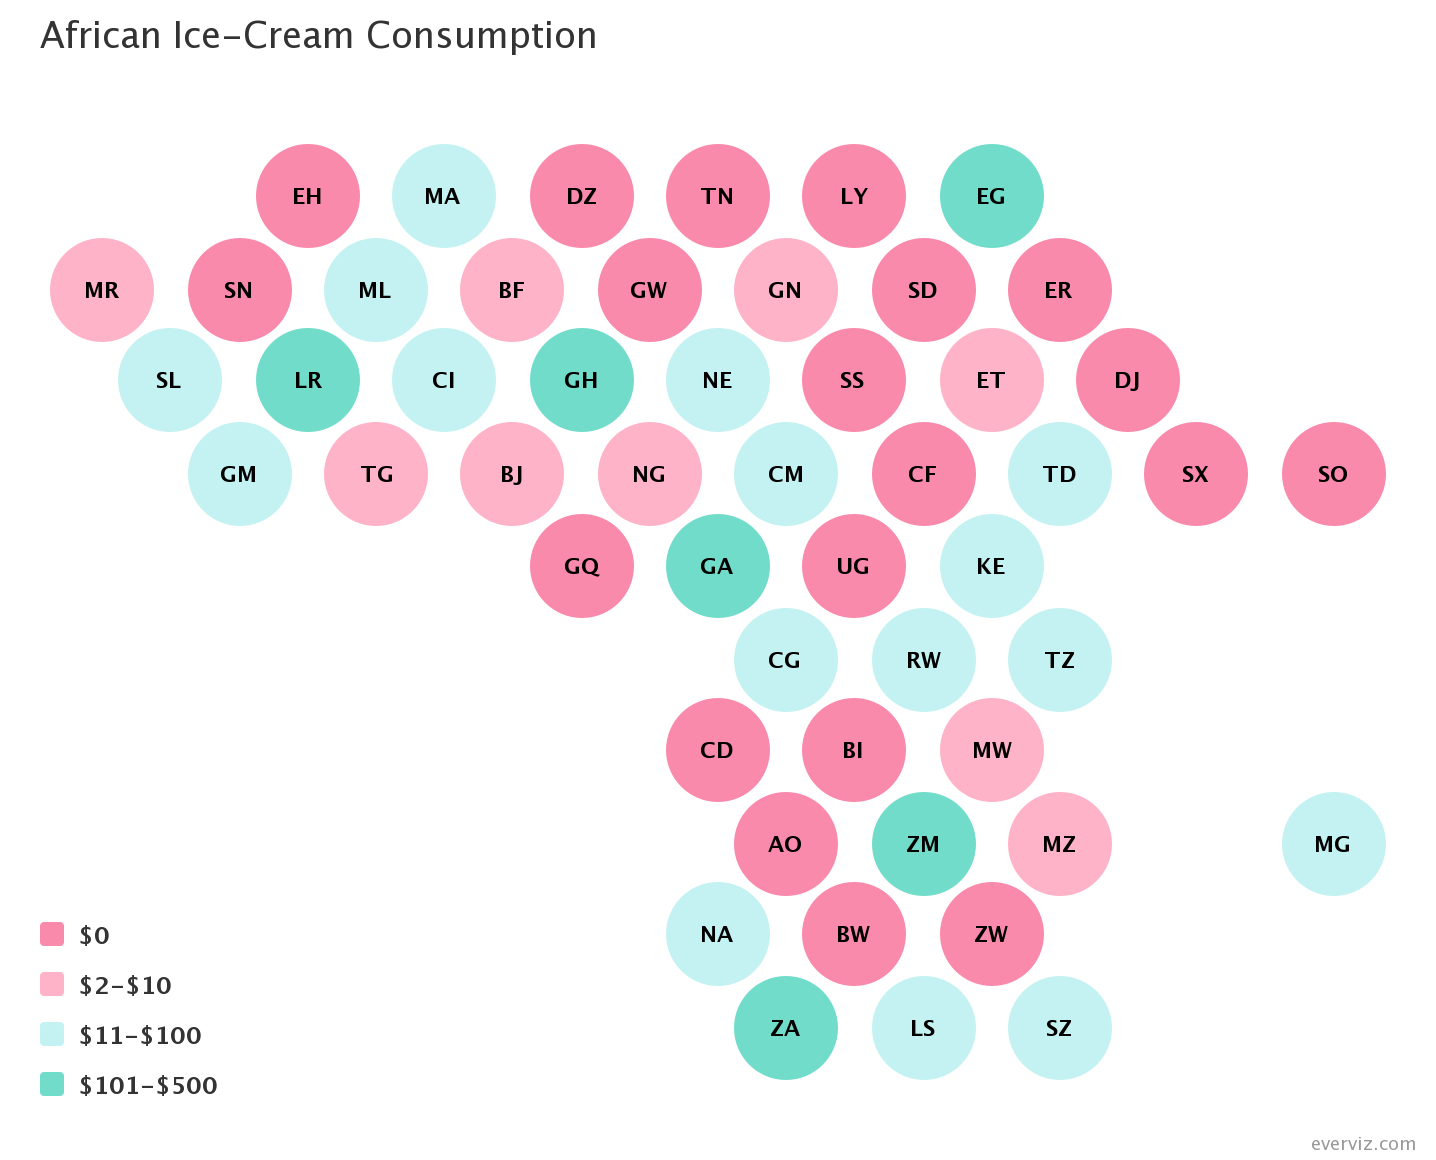
Hexagonal tilemap, sometimes referred to as a honeycomb or hexbin chart, showing election data in the US.
In this case the map is used to show each US state with the same size – which removes some of the bias associated with traditional maps.
In this case the map is used to show each US state with the same size – which removes some of the bias associated with traditional maps.


