
The Telegraph’s inclusive approach to visualizing the news
Simplifying complex information in news stories is key to reader engagement at The Telegraph. Charts and maps from everviz help readers understand at a glance
Simplifying complex information in news stories is key to reader engagement at The Telegraph. Charts and maps from everviz help readers understand at a glance
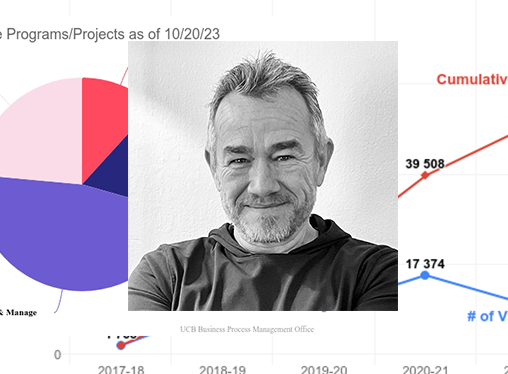
The University of California, Berkeley places high standards on their data visualizations. Charts must update in real time, satisfy web accessibility requirements, feature university colors
Charts are key to marketing efforts at Thornburg, a US-based Investment firm. Their thought leadership content is found on multiple platforms, including their website, social
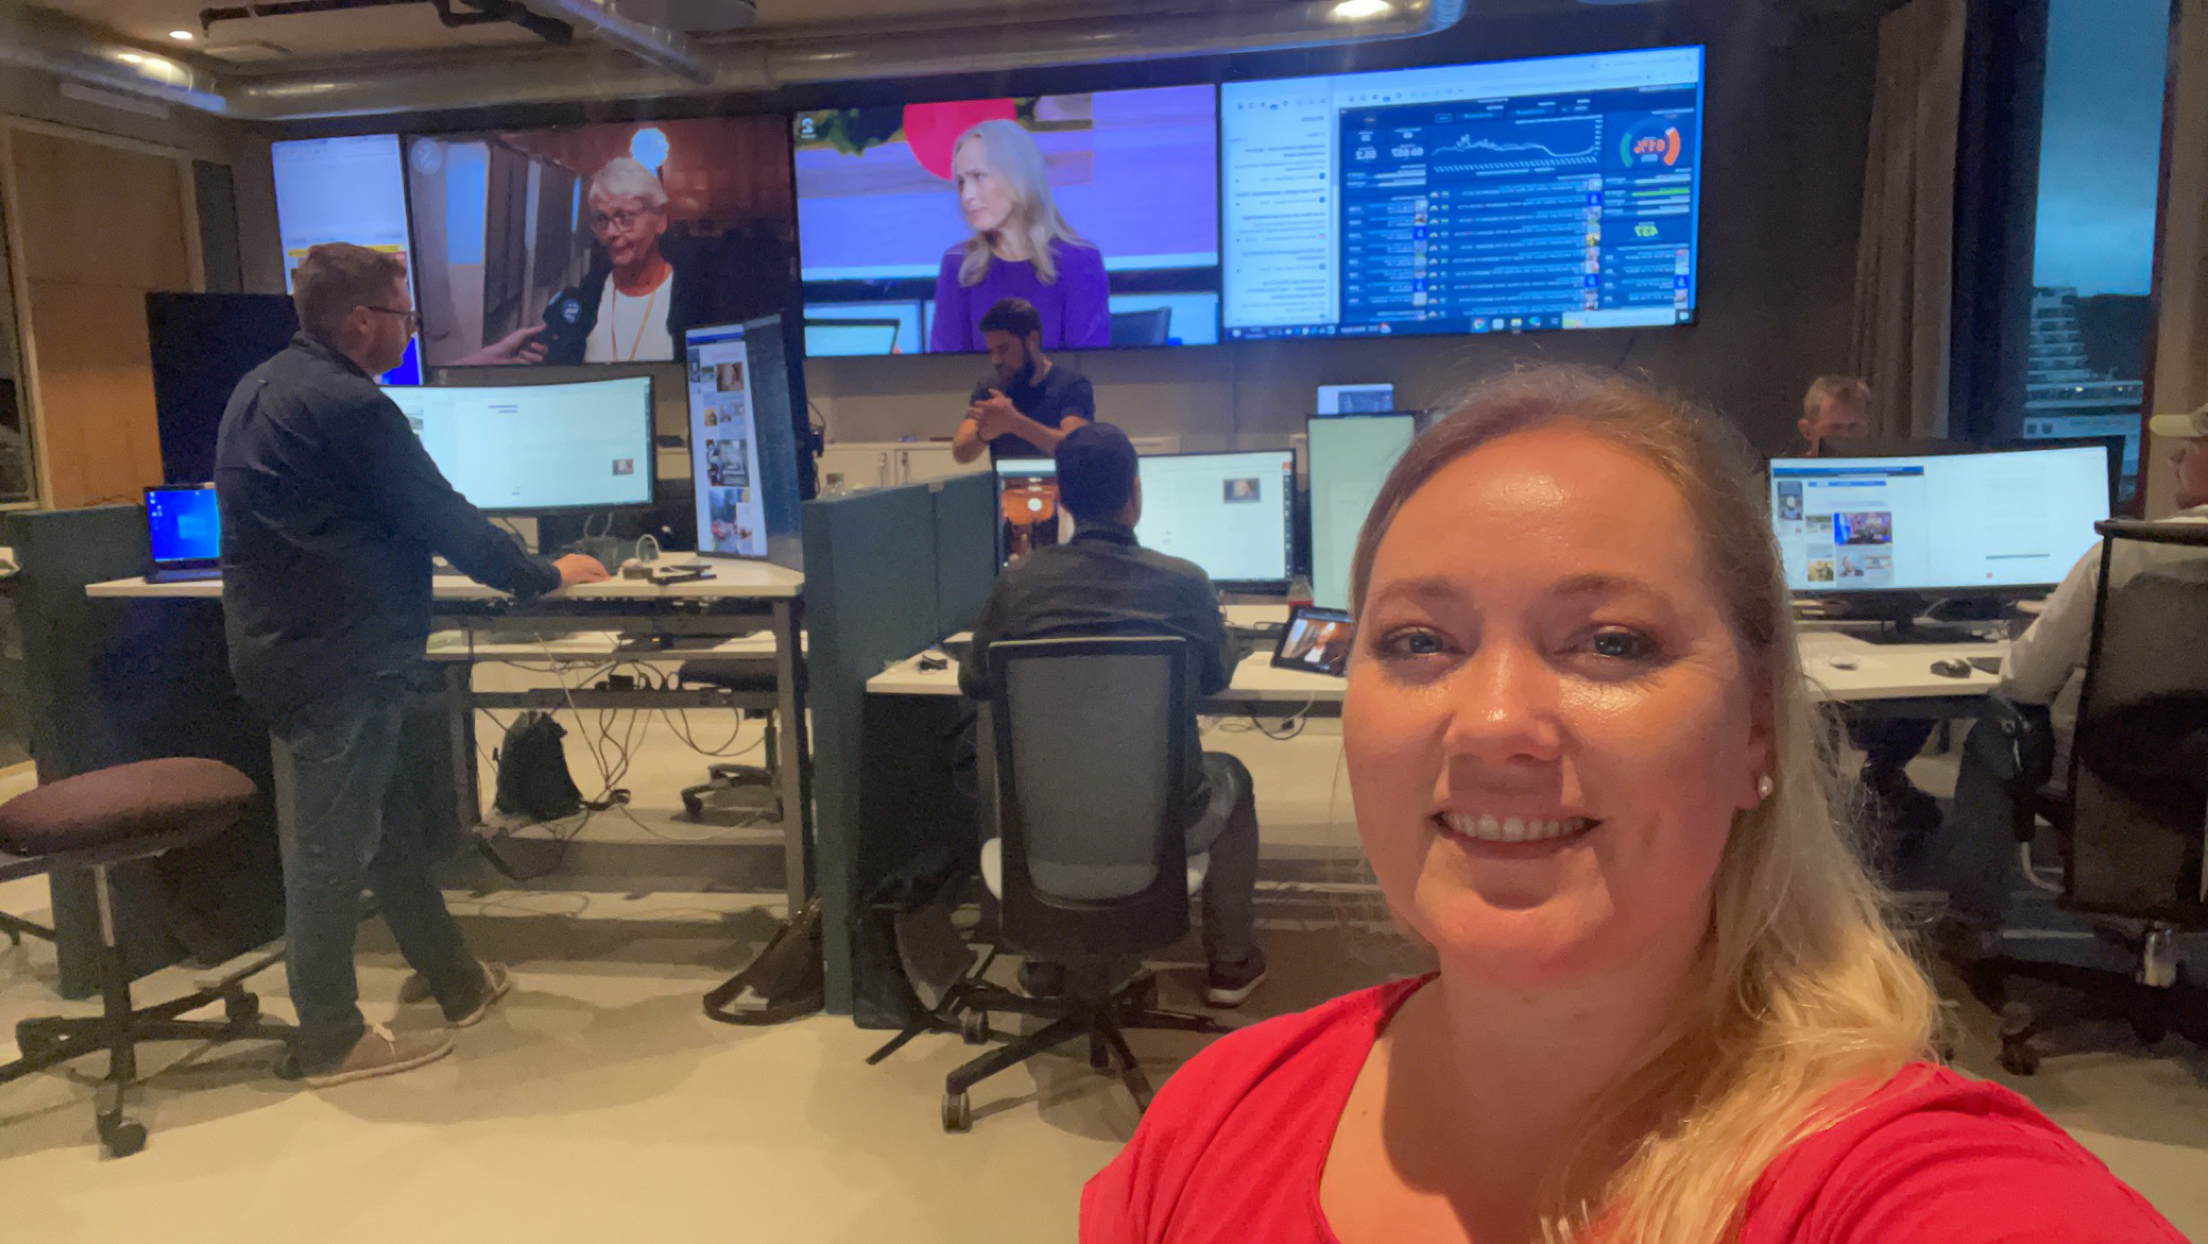
Something extraordinary marked this year’s election coverage at Sunnmørsposten (SMP) newspaper. For the very first time, data graphics enriched the live election night stream. Liv-Jorunn Håker,

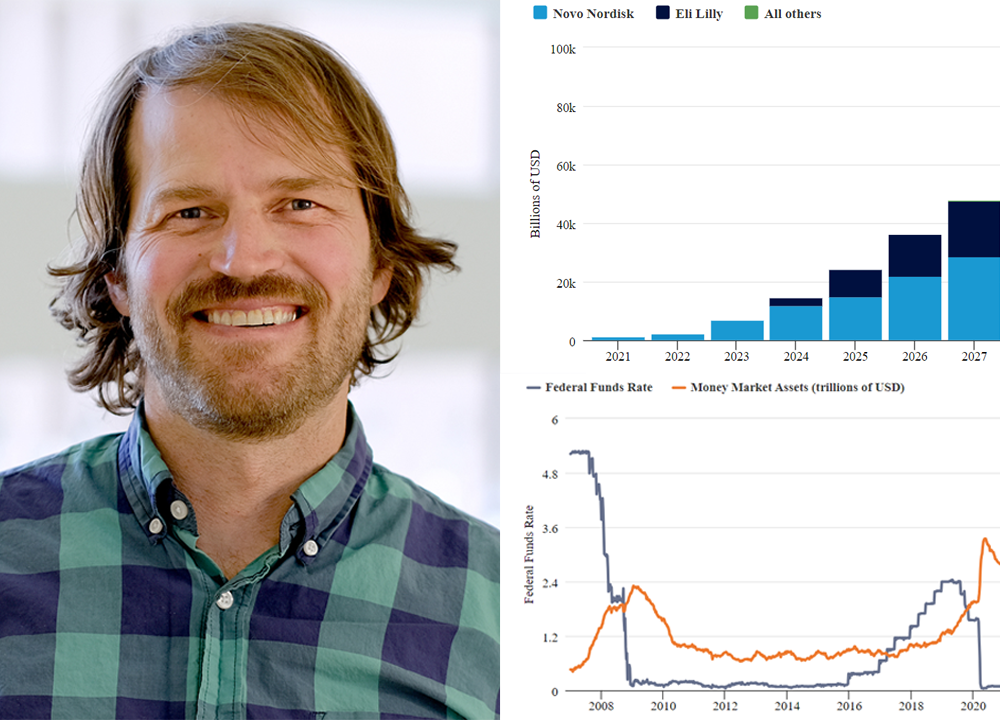
Based in São Paulo, Riza specializes in asset management services. Riza helps clients achieve their financial objectives while managing risk effectively. In this post, Riza

Introduction Morning Consult analysts work with millions of data points that reflect public sentiment on various topics. Their reports are packed with data, posing the

Sunnmørsposten newspaper (SMP) is located in Ålesund, a city of 67,000 nestled in the beautiful fjord landscape of Western Norway. The newspaper has 2.5 million

The world’s most accessible data visualisations are likely created in Norway by the Authority for Universal Design of IT (the Authority). In Norway, all public
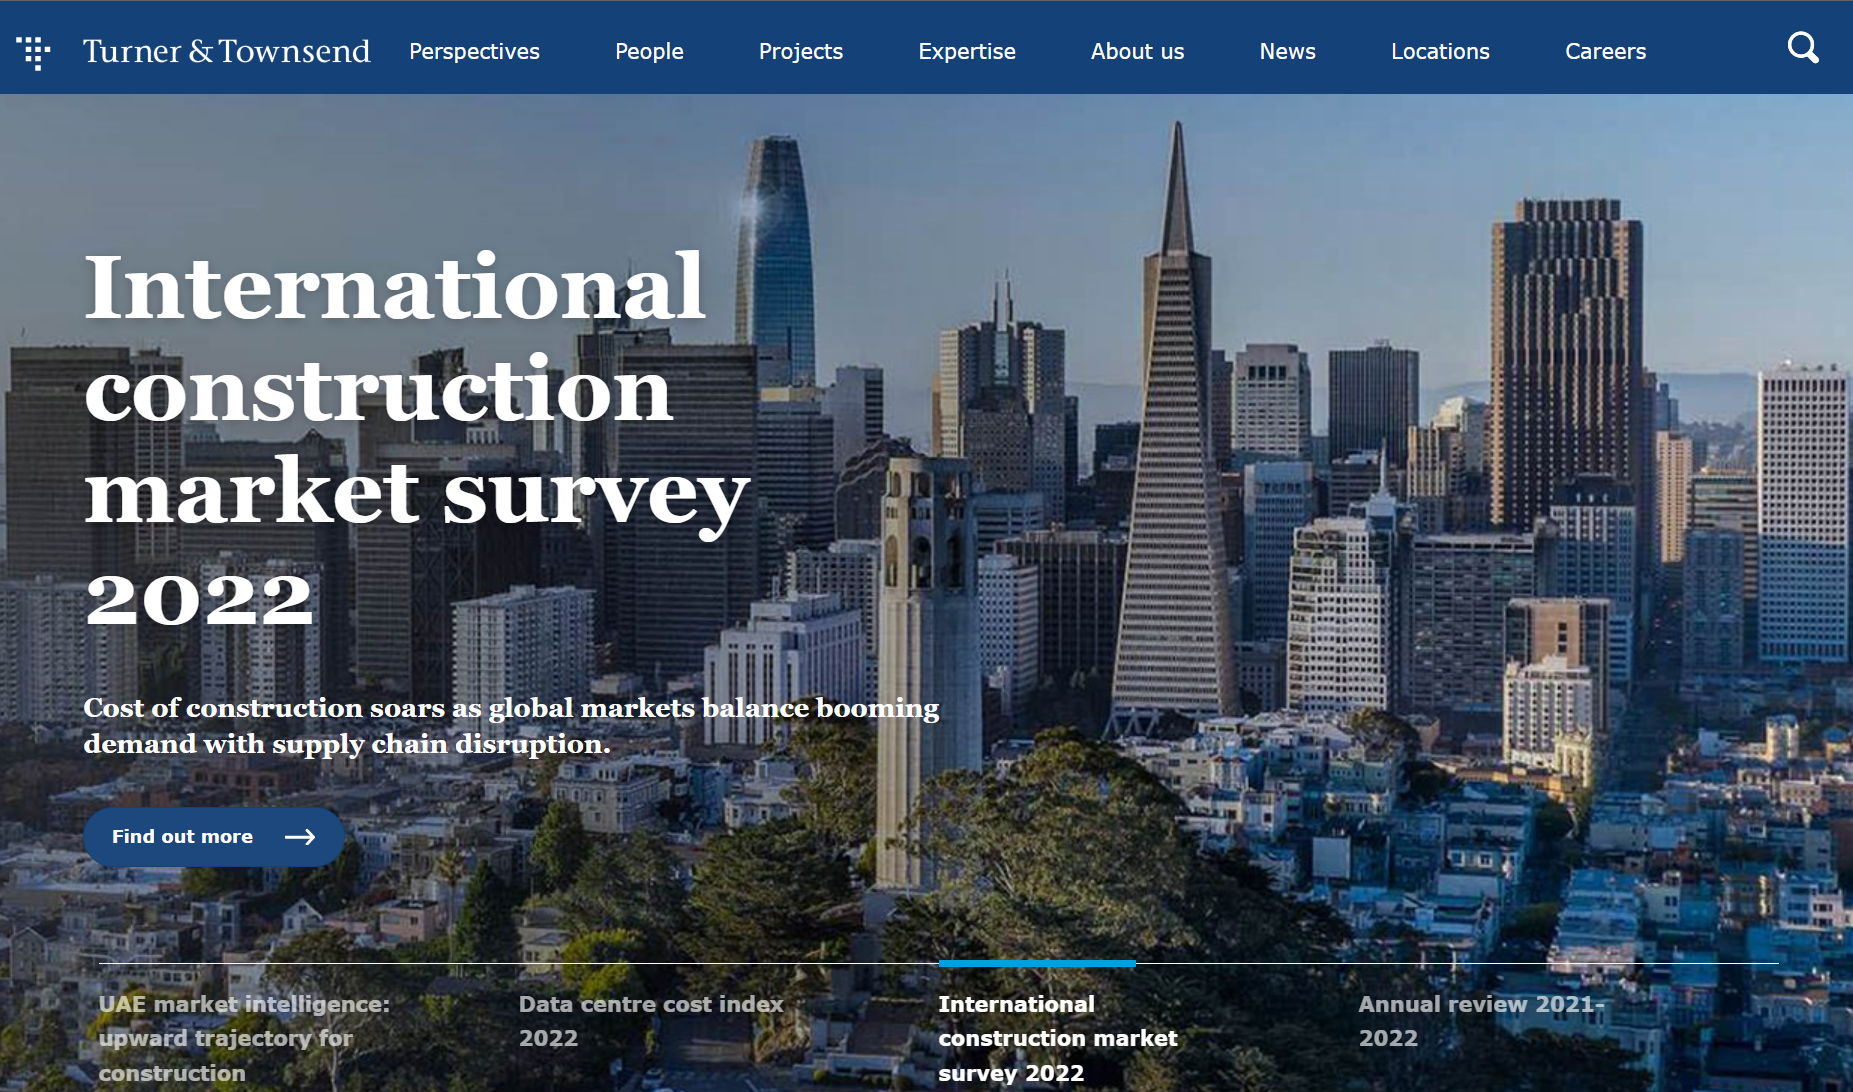
‘With a chart, clients instantly see the highs and the lows and the differences in the data’ Turner & Townsend is a global professional services
